A plain-language guide to building a 1 GW gas plant for AI compute. Read the top first. Click anything to go deeper.
Author: Bill Bubenicek, W.A. Bubenicek Development LLCReference: 1 GW gas, ERCOT, BTM ramp 2028 → full power 2031 → grid 2032Last updated: May 2026
Bottom Line
Purpose. This document bridges the gap in baseline understanding between three stakeholders building hyperscale AI infrastructure: the data center developer, the hyperscaler off-taker, and the energy infrastructure developer. Each plays a critical role; each carries different risk; each operates with capital that has a different cost, time horizon, and tolerance. The aim is shared situational awareness, so the three can coordinate optimally on capital allocation given the physical infrastructure constraints described throughout.
What this is. A reference for building a 1 GW gas plant co-located with a 1 GW hyperscale data center. ERCOT primary, PJM (Ohio/PA) comparison.
Why it's hard. Physical infrastructure (gas pipelines, transmission, large power transformers and switchgear, air permits, turbine OEMs, skilled labor, interconnection queues, water in growth regions) is the binding constraint on US AI compute through 2030. Multiple primary sources (EIA, INGAA, FERC, ERCOT, PJM, DOE, BLS, CBRE/JLL, BCG, McKinsey, S&P Global) support this view. A 4 to 7 year gas plant build cannot keep pace with a 12 to 18 month data center build, and adjacent infrastructure constraints (transformers, labor, water) compound the timeline mismatch.
How the market solves it near-term. Industry deployment patterns in 2025-2026 use behind-the-meter modular gas as a 12 to 24 month bridge to grid-tied combined cycle, in hybrid configurations supported by hyperscaler offtake commitments. This is a near-term bridge to longer-term firm-power solutions (nuclear restart and SMRs, renewables-plus-storage at firm-power scale, hybrid configurations) emerging through 2028-2032.
Firm gas transport in growth corridors is the structural input most often underestimated. Whoever holds long-tenor firm capacity controls who can build at GW scale.
Practical implication. Site quality alone is no longer sufficient to underwrite. Firm gas transport, an air permit pathway, a turbine reservation, a credible grid interconnection plan, and a hyperscale IG offtake commit are all required before financial close. The chained dependencies are the project-on-project risk; one slip cascades.
Where to read depth. Executive View (~1,000 words) → Reference Project + Master Visual → 30 Executive Summary cards → 30 Deep Dives → Takeaways.
Scope and Framing
This document is about current deployment realities and the physical infrastructure constraints affecting power and data center buildouts at AI scale. It is not a directional bet on any single fuel, technology, or sponsor. The thesis, supported by the data summarized throughout, is that physical infrastructure across multiple categories (gas pipelines and transmission, electrical equipment, water, materials, labor, permitting, interconnection, and capital) is binding on US AI compute growth through 2030 and beyond.
Gas-fired generation receives detailed treatment because it is, on current evidence, the dominant near-term bridge solution in most ISOs through 2028 (BTM modular gas, then phased simple-cycle gas turbines, then combined-cycle conversion). Gas is framed as a bridge, not a destination. The longer-term power evolution emerging through 2028-2035 includes nuclear restarts and SMR deployment, renewables-plus-storage at firm-power scale, and hybrid configurations across all three. Each of those receives proportionate coverage in the relevant sections.
The document is source-anchored where possible. Where data is genuinely uncertain (peak demand timing, technology delivery dates, regulatory direction), it is flagged as such with explicit confidence levels. Readers should treat the analysis as a current snapshot of industry conditions and a framework for stress-testing assumptions, not as investment advice.
The Three Stakeholders
The document is written primarily for three stakeholder roles that must coordinate on every hyperscale AI infrastructure project, each operating with materially different capital, risk tolerance, and time horizon. Effective coordination requires each role to understand the constraints the others operate under. The cross-stakeholder optimization is the central capital-efficiency question, covered in Deep Dive 30.
Stakeholder
Capital profile
Time horizon
Primary risk concerns
Strategic priority
Data center developer
Digital infra and real estate mandates; 25-40% dev IRR (3-4 year hold), 8-10% stabilized, long-term hold cash payback at 9-11% YoC
DC build 12-18 months; stabilization 3-4 years; lease 15 years
Site selection, construction, lease tenant credit, residual value at frontier sites
Securing IG offtake at site signature
Hyperscaler off-taker
Corporate balance sheet; very low cost of capital (~3-5% WACC); enormous scale ($500B+ combined annual capex)
Compute online date drives revenue (12-18 month deployment); willing to commit 15-20 year PPAs/leases for power
Compute timing (revenue gating), power delivery certainty, total cost of compute
Compute online date on or ahead of plan
Energy infrastructure developer
Infra fund mandates plus project finance debt; 8-12% unlevered IRR, 14-18% levered; longer holds and longer asset life
Plant build 4-7 years; stabilization 6-8 years; PPA 15-20 years; asset life 25-30 years
These three roles bring different capital with different costs of bearing different risks. The economic optimization is to assign each risk to the party with the lowest cost of bearing it. Done well, all three parties capture more value than they would in a bilateral or single-party structure. Done poorly, risk concentrates on parties that cannot efficiently bear it, capital cost rises across the stack, and projects either stall or get repriced. Deep Dive 30 covers the optimization framework in detail.
Executive View
The thesis in roughly 1,000 words. Read this if you read nothing else.
The 1 GW data center campus is a real estate project. The 1 GW power plant is an infrastructure project. Same site, same hyperscaler, overlapping but distinct investor universes (energy infra and DC infra draw from related but distinct LP bases , utility-style infra mandates with project-finance debt and longer hold for energy, digital infrastructure / real estate mandates with REIT-style economics and shorter hold for DC; the largest infra funds participate in both via separate teams and sub-strategies), completely different clocks.
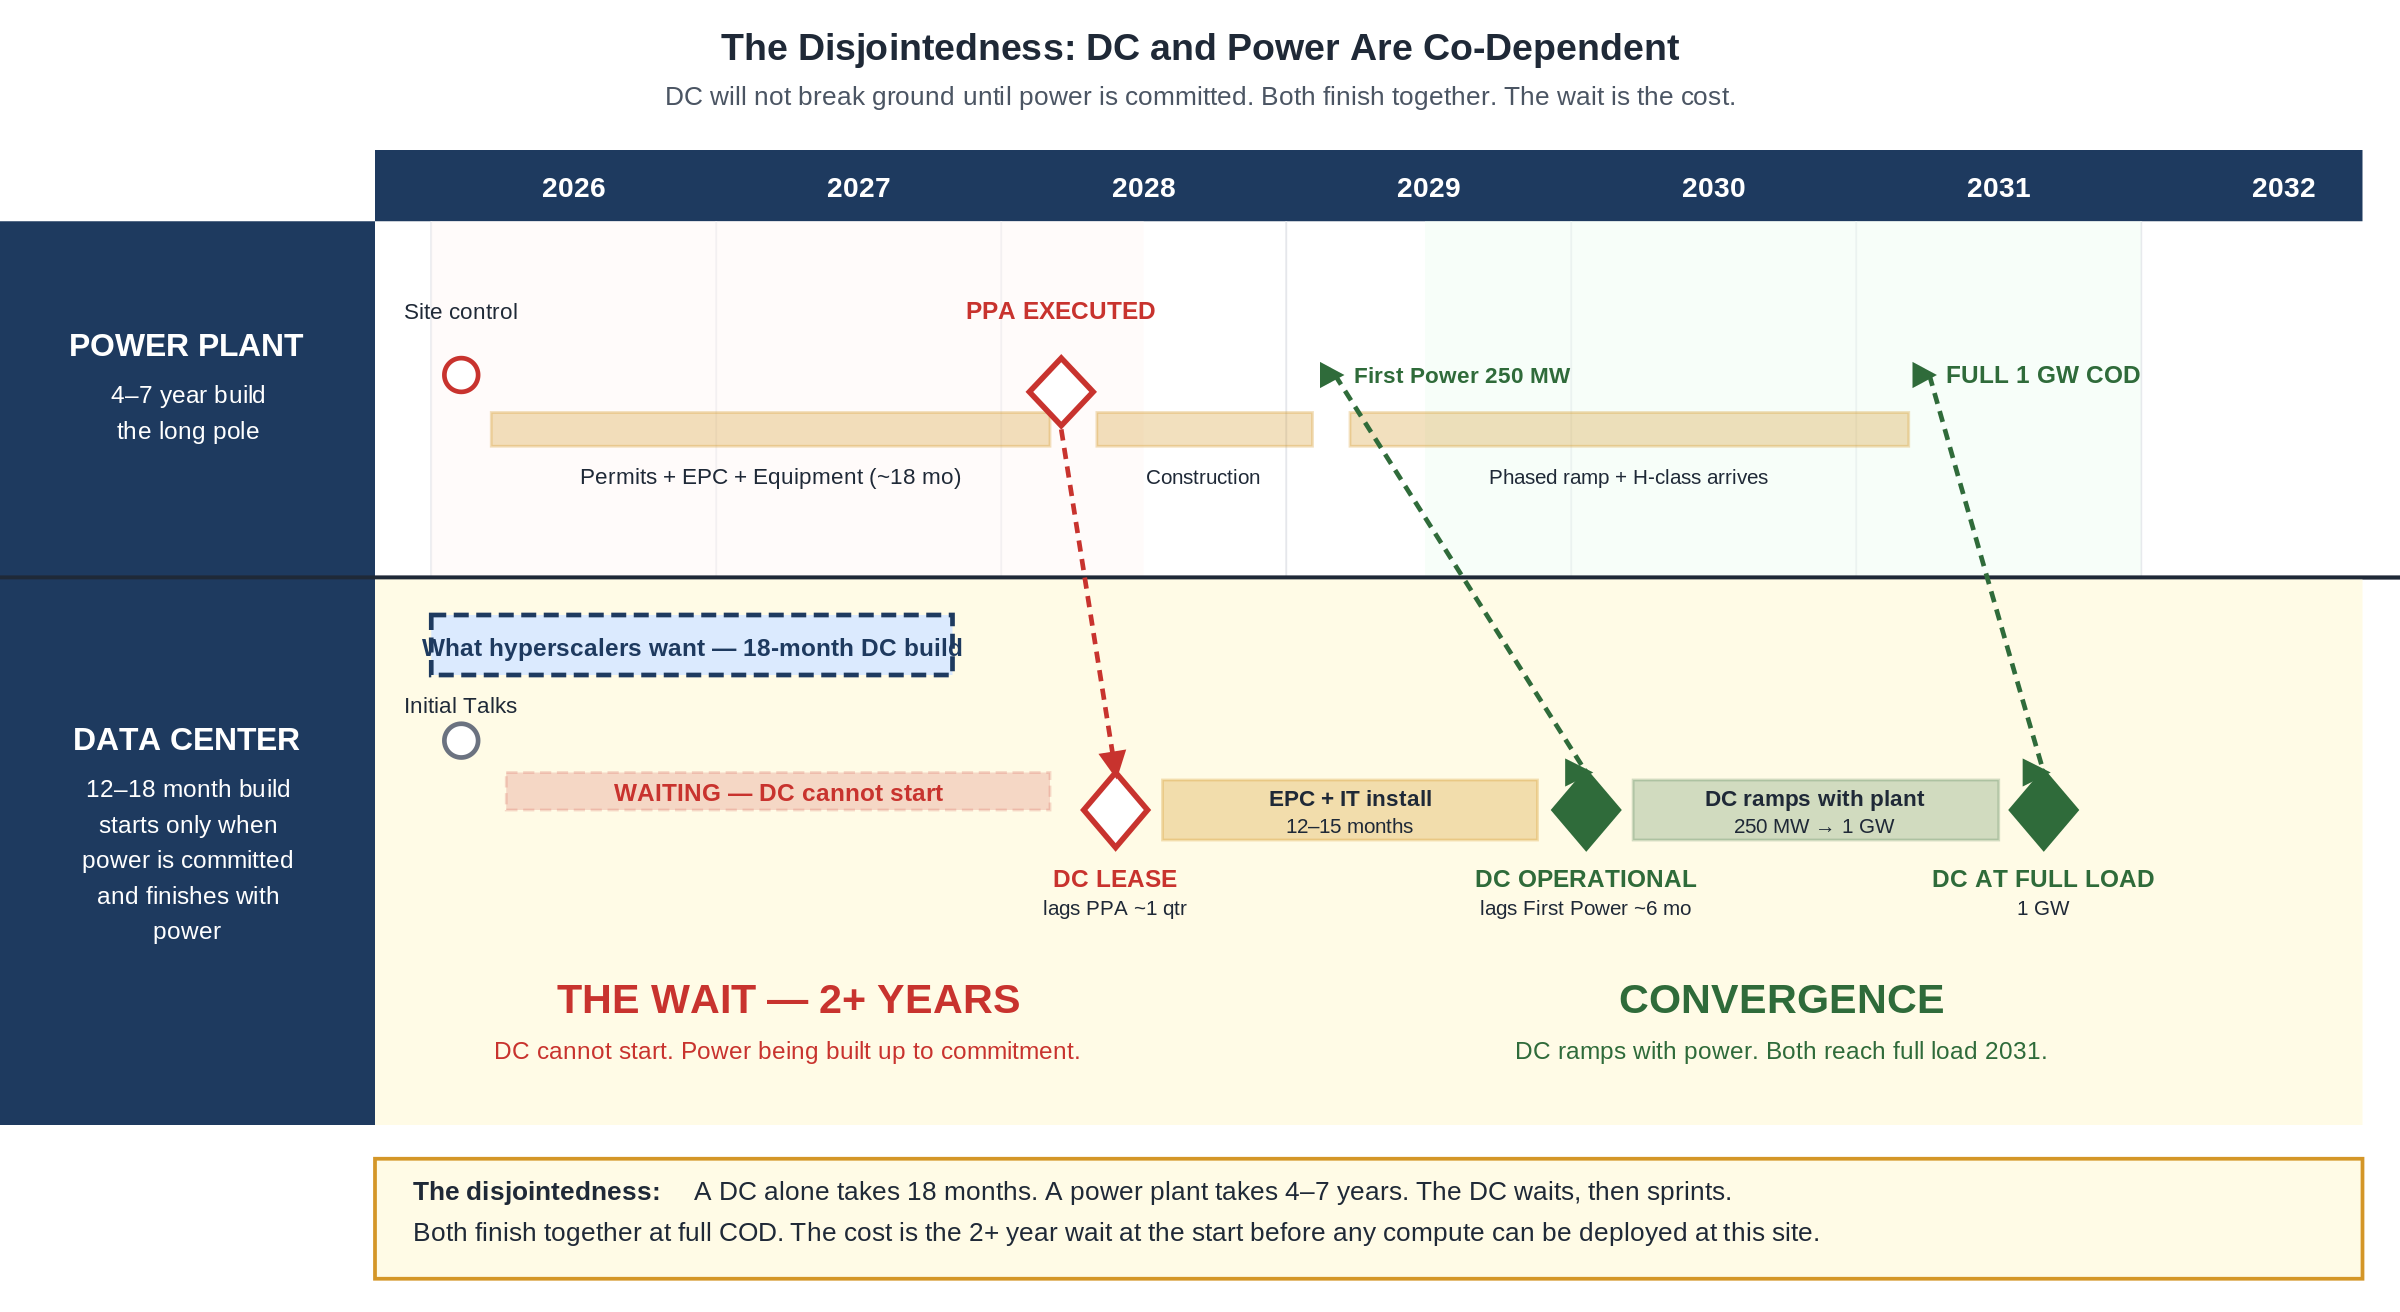
A data center can be designed, permitted, and built in 12-18 months once the site is de-risked. A gas-fired power plant takes 4-7 years. The hyperscaler will not sign a 15-20 year lease without firm power. The energy developer will not commit dev capital without a signed PPA. The result is a 3-year structural gap between when the data center is ready and when the energy plant can deliver firm full power.
The 3-year gap (shaded) is the central problem the integrated DC + power model has to solve. The data center is online but underfed. The plant is partly built. The hyperscaler waits, ramps slowly, or bridges with grid backstop and modular gas.
What the market is actually trying (near-term, 2026-2028)
Three approaches are running in the field today. Each addresses one piece of the constraint; none fully closes the 3-year gap. Only one of them actually compresses physical build time. The others change ownership or financing. Beyond the near-term, the market is also deploying longer-cycle solutions (nuclear, SMRs, renewables-plus-storage at firm-power scale) covered in the Macro Limit and Three Paths to Power sections.
1. Phased ramp with modular gas. Oracle Shackelford (700 MW VoltaGrid), Meta El Paso (366 MW modular Caterpillar), xAI Memphis (27+ turbines). What it does: compresses time to first compute by deploying reciprocating engines in months rather than years. Phase 1 power lands in 12-18 months from NTP, well before H-class turbines arrive. What it doesn't do: it doesn't compress time to full 1 GW, that still takes 4-7 years. This is the dominant near-term strategy for compressing the compute deployment date (see Deep Dive 22 Assumption 4 for alternatives , nuclear restart, SMRs, grid arbitrage , and their constraints).
2. Hyperscaler vertical integration. Google's ~$4.75B acquisition of Intersect Power's digital power assets (reported Dec 2025; verify exact terms before any external use). What it does: removes the counterparty negotiation friction. One party now owns both sides. Captures all power margin internally. What it doesn't do:does not compress the physical build timeline. Owning the developer doesn't make permits faster, turbines arrive sooner, or pipelines build quicker. Google still waits 4-5 years for full power. The strategy changes who owns the value chain, not how long the chain takes.
3. Utility partnership. Meta Richland Parish with Entergy ($3.2B utility capex, $10B+ Meta DC). What it does: regulated-utility credit improves financing, capacity market revenue (in PJM) adds a second revenue stream, and risk shifts onto the utility ratebase. What it doesn't do: doesn't compress the build. Same 4-5 year physical timeline.
Phased modular gas is the dominant near-term accelerator through 2028, with the alternatives (nuclear restart, SMRs, grid headroom arbitrage, transmission expansion, renewables-plus-storage at firm-power scale) covered in Deep Dive 22 Assumption 4 and the Macro Limit section. Vertical integration and utility partnership help with coordination, financing, and margin capture, but they do not by themselves close the 3-year gap. That gap is structural and physical, driven by permits, pipelines, transmission, transformers, turbines, water, and EPC labor, none of which respond to ownership structure alone.
The path forward: BTM acceleration as near-term bridge
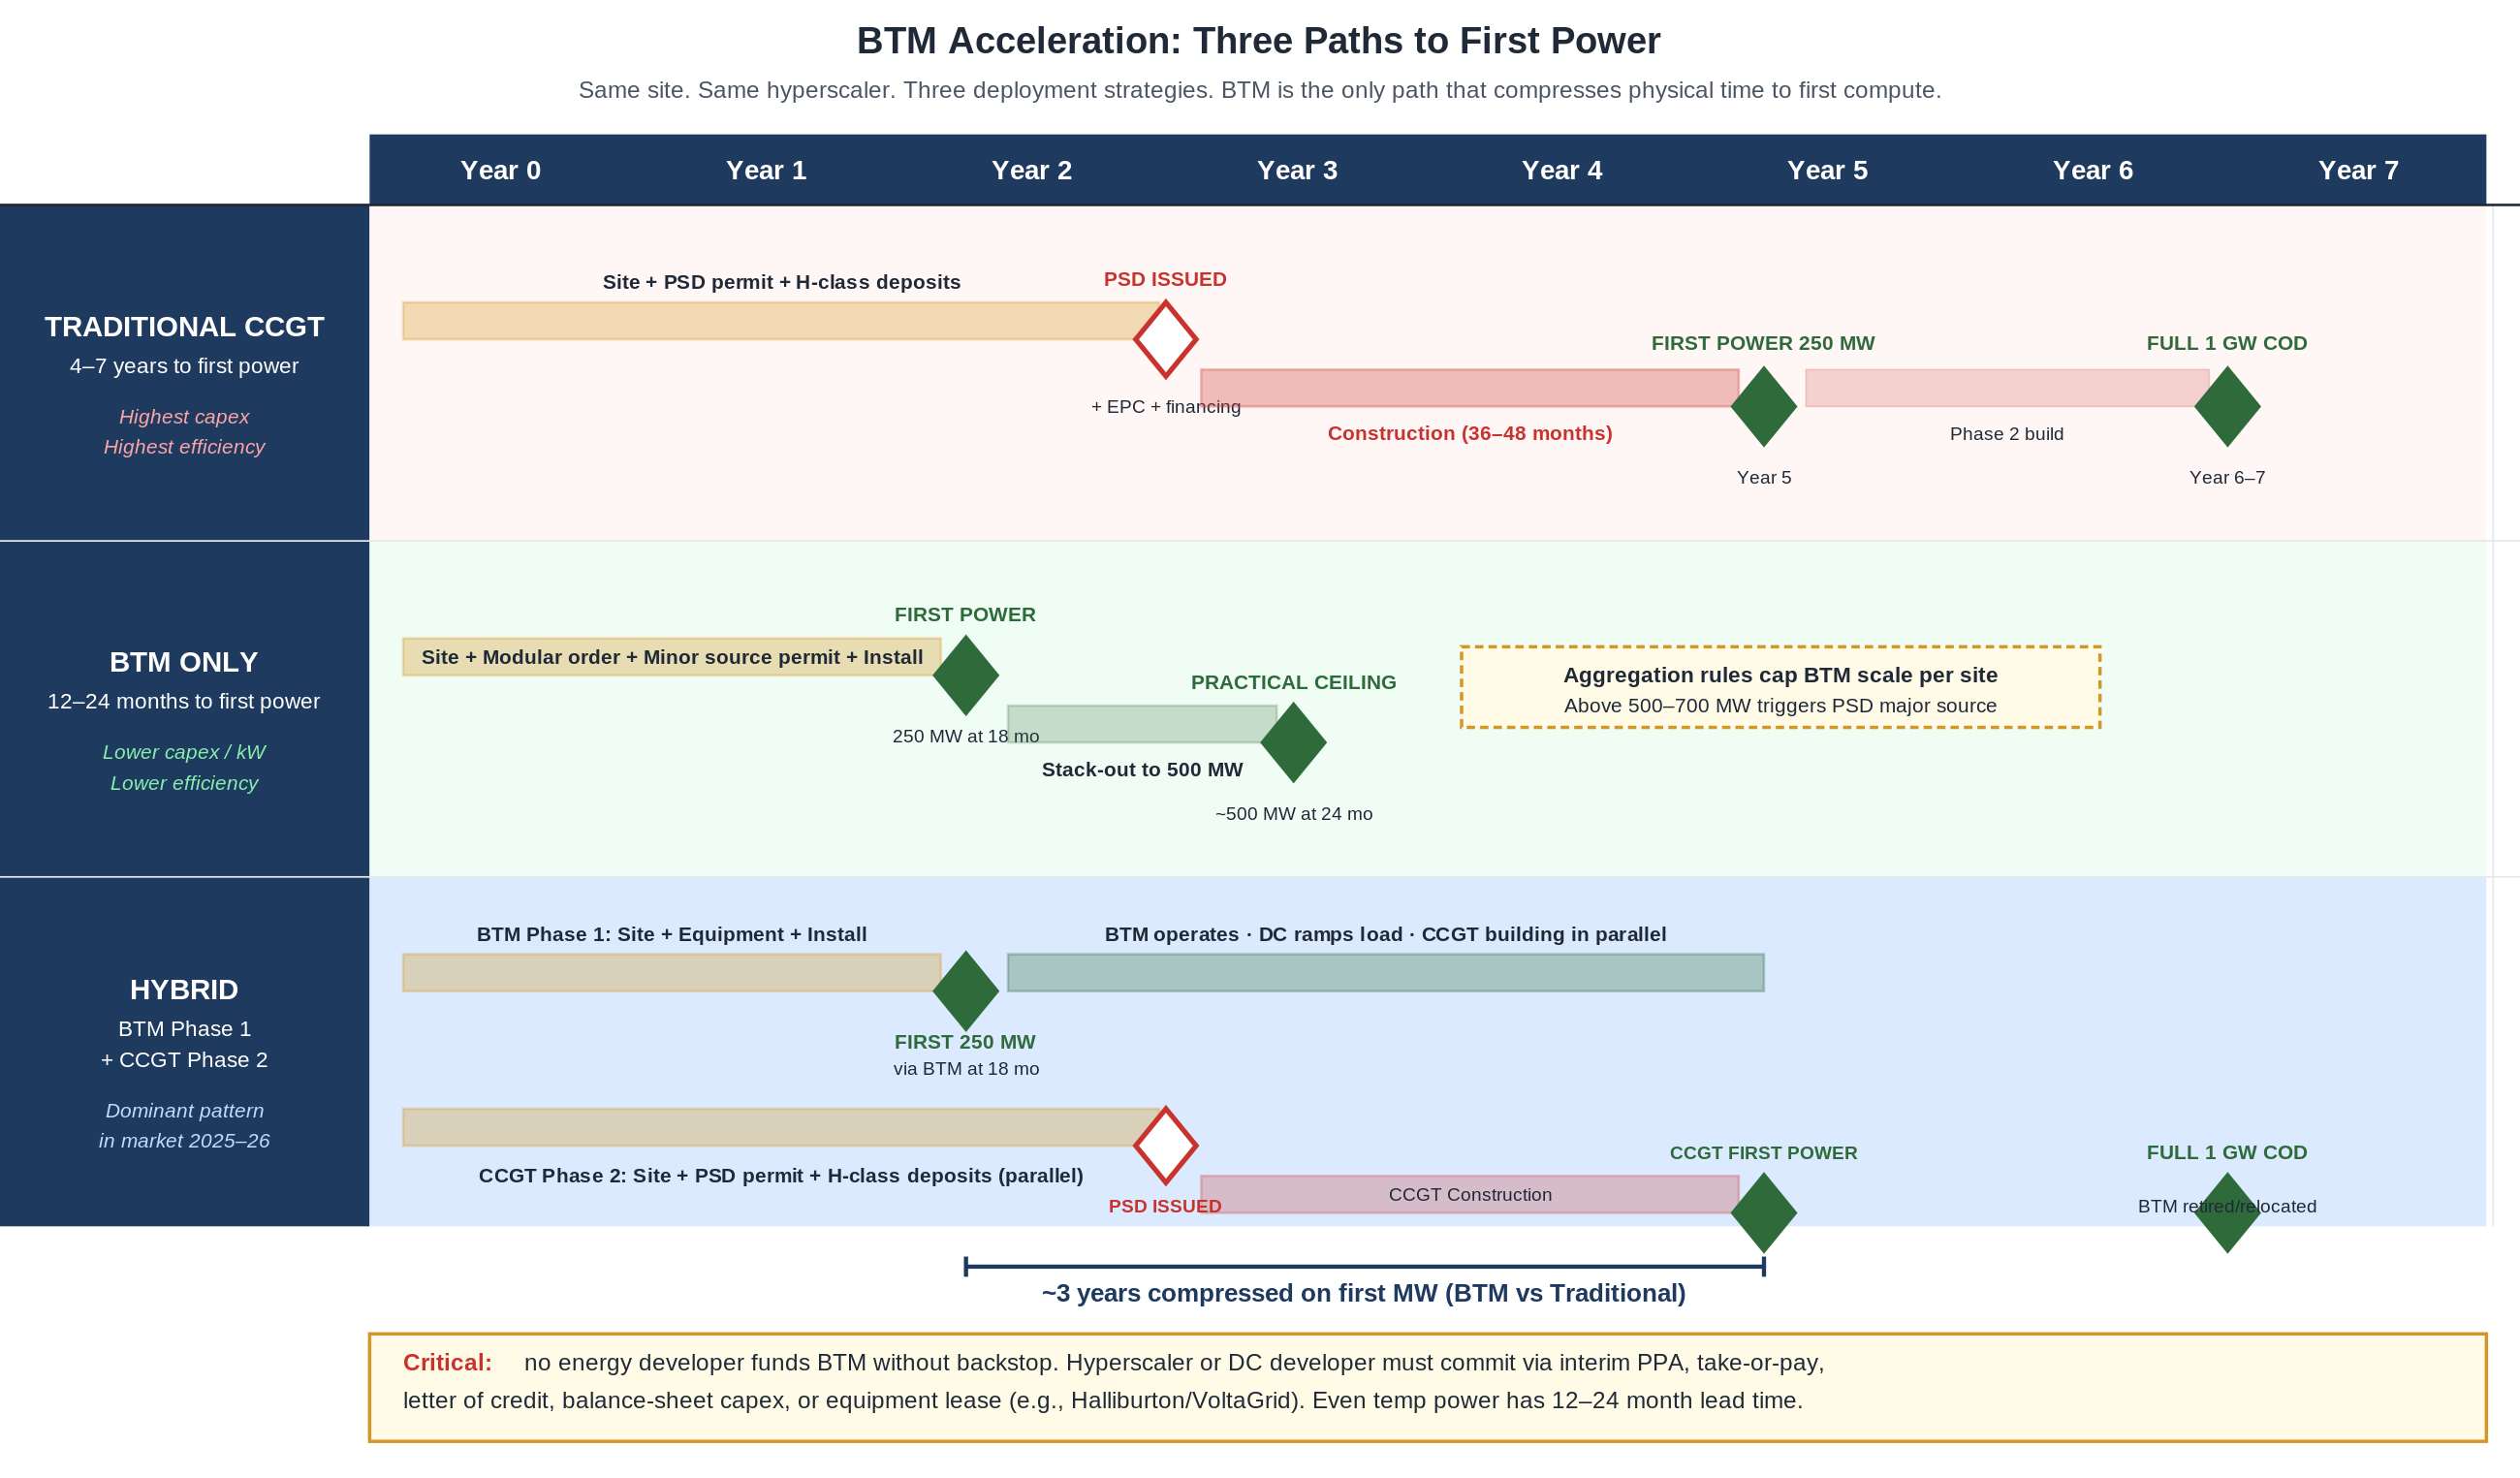
The 3-year gap is closed in practice today by behind-the-meter (BTM) modular gas, framed as a near-term bridge rather than a permanent destination. The dominant deployment pattern compresses physical time to first power, from 4-7 years for traditional CCGT to 12-24 months for modular reciprocating engines (Wärtsilä, Caterpillar, INNIO, deployed via VoltaGrid and similar integrators). Every major hyperscale project shipped in the last 18 months has used some form of BTM gas, and most pair it with a planned transition to grid-tied CCGT or alternative firm-power solutions over a 5-10 year horizon.
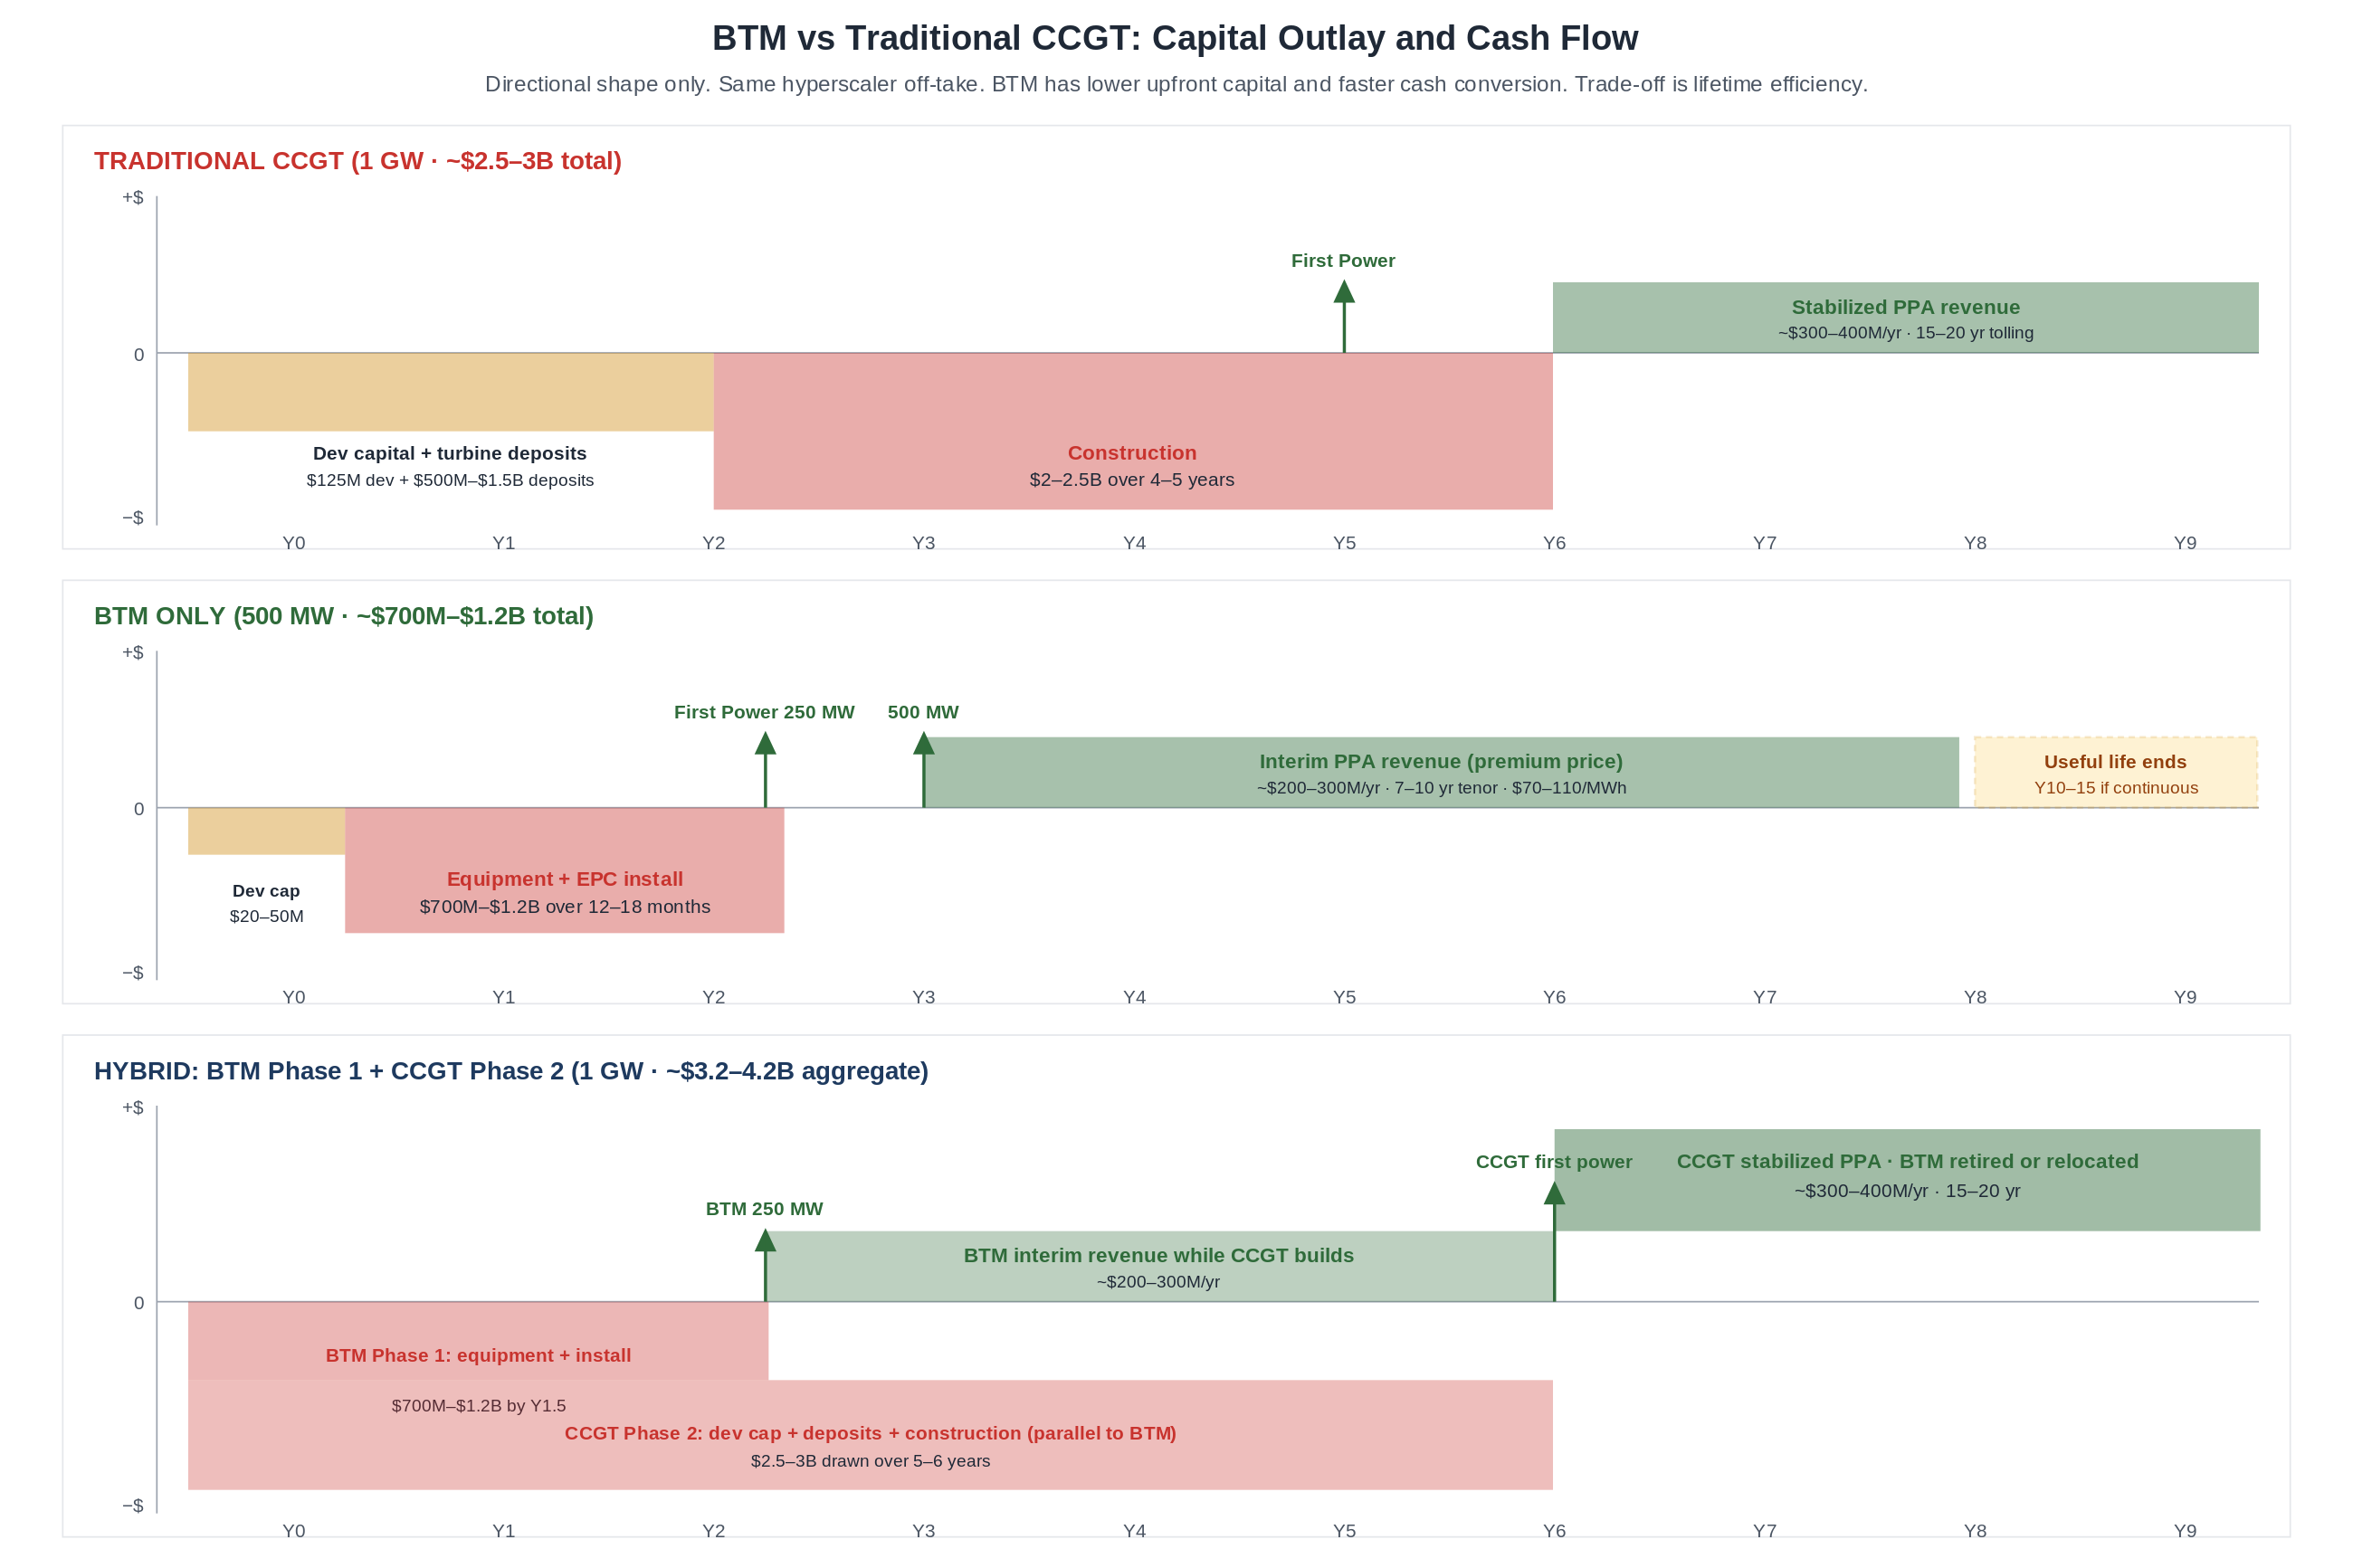
Same site, same hyperscaler, three deployment strategies. BTM compresses ~3 years out of the path to first compute.
What's different about BTM:
Capital outlay compressed. Typical minor-source BTM deployment: $700M-$1.2B for 500 MW in 12-24 months. Larger BTM (1 GW+) is possible under PSD major source review (adds 18-24+ months to the permit; capex scales roughly linearly to ~$1.4-2.4B). Compare to traditional CCGT: $2.5-3B for 1 GW in 4-7 years. Lower per-kW upfront for BTM, but lower efficiency over life.
Backstop is non-negotiable. No energy developer funds BTM without hyperscaler or DC committing via interim PPA, take-or-pay, letter of credit, balance-sheet capex, or equipment lease (Halliburton/VoltaGrid pattern). The backstop is the project.
Underwriting changes for both sides. Energy: 7-10 year PPA tenor vs 15-20, 40-50% sponsor equity, debt premium 200-300 bps, IRR target 12-15% vs 8-12%. DC: same dev IRR (25-40%) but compute-online date moves up 3 years.
Hybrid (BTM Phase 1 + CCGT Phase 2) is the dominant pattern. Reference project uses this. BTM compresses time to first compute. CCGT delivers full 1 GW long-term. BTM gear retires or relocates when CCGT comes online.
The headwinds are real. BTM has structural efficiency penalty (35-42% vs CCGT 50-64%, 25-40% higher fuel cost per MWh), recip-engine emissions/permitting scrutiny per MW (1.5-3× CCGT), relocation cost on hybrid timelines ($200-400/kW), and short-tenor PPA fuel-price exposure that compounds in tight basins. Section 18 covers the downsides explicitly. BTM wins on speed , it does not win on lifetime economics.
Full treatment in Deep Dive 18 (BTM Acceleration). The standalone BTM_Analysis document covers the case in greater depth.
The financial disjointedness
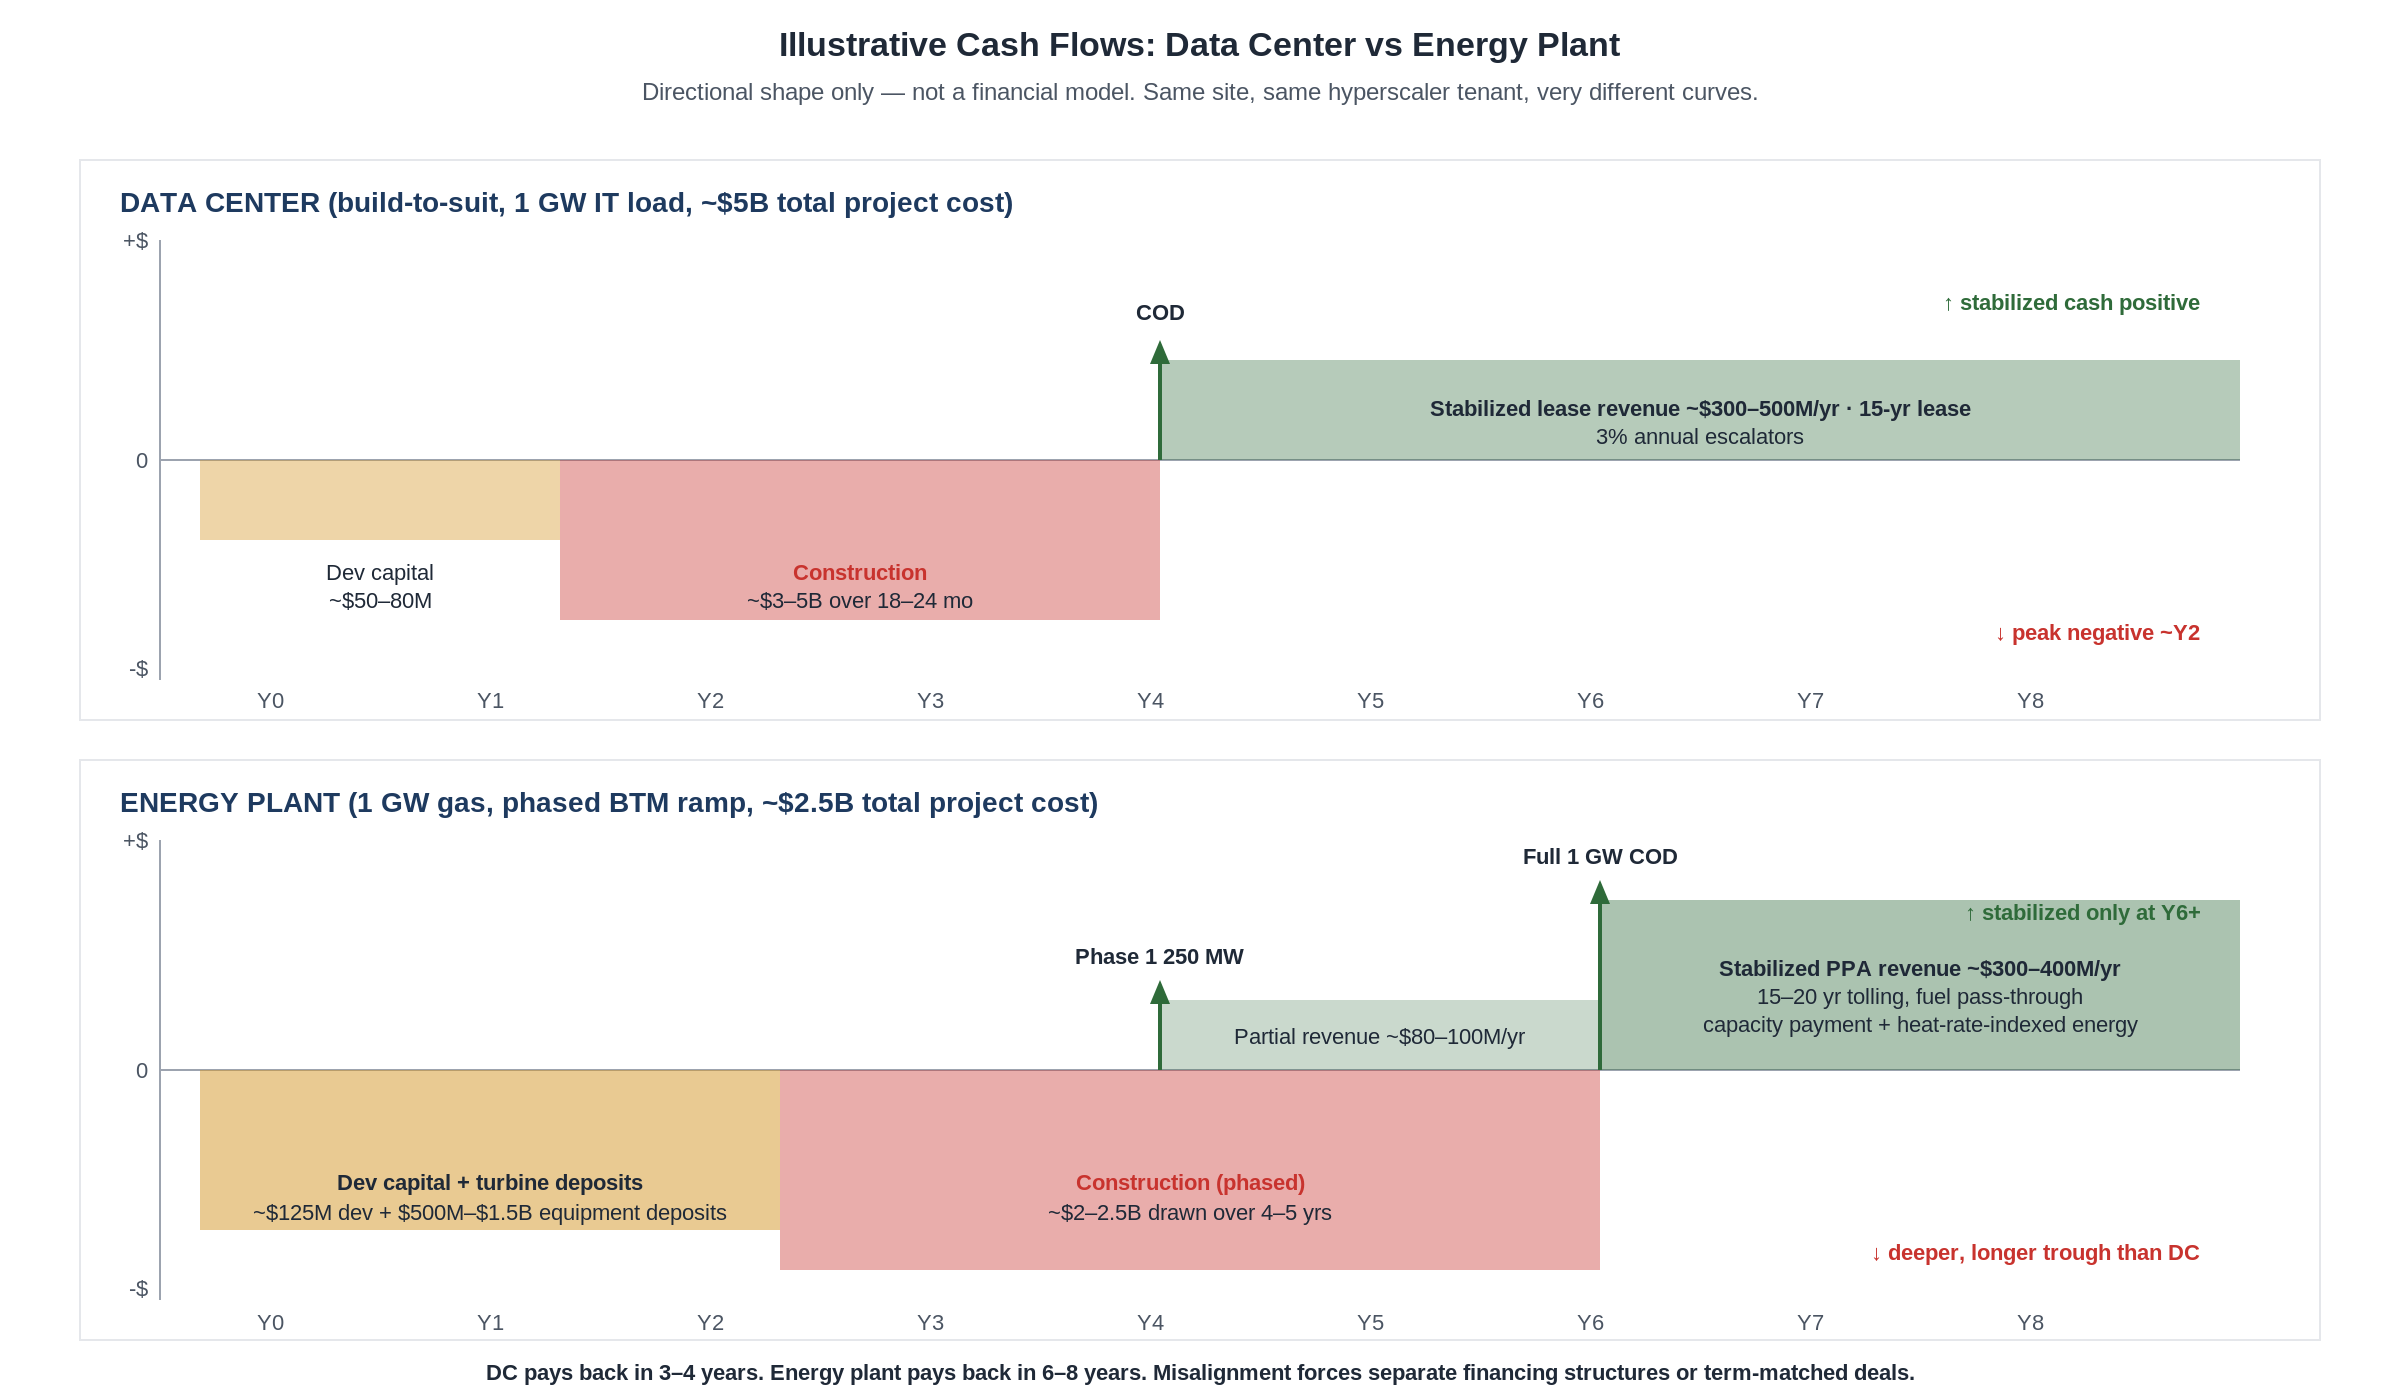
The DC and energy plant don't just have different timelines, they have different cash flow shapes. The DC reaches stabilization in 3-4 years (developer hold-to-flip model, exit at cap rate captures 25-40% dev IRR). Full cash payback at typical 9-11% yield on cost is closer to 9-11 years for a long-term hold. The energy plant reaches stabilization in 6-8 years. Either way the misalignment between the two timelines forces separate financing structures or term-matched deals. The capital-efficient solution is cross-stakeholder coordination: allocate each risk to the party with lowest cost of bearing it, given the three roles' different capital costs (DC developer at 25-40% dev IRR, energy developer at 8-12% unlevered, hyperscaler at near-balance-sheet cost) and different time horizons. Deep Dive 30 covers this framework.
Directional shape only, not a financial model. The DC trough is deep but short (sharp inflection at COD year 3). The energy plant trough is deeper and longer (4-6 years of negative, partial revenue mid-trough, full revenue much later). Two cash flow shapes that do not naturally share one capital stack.
The macro limit
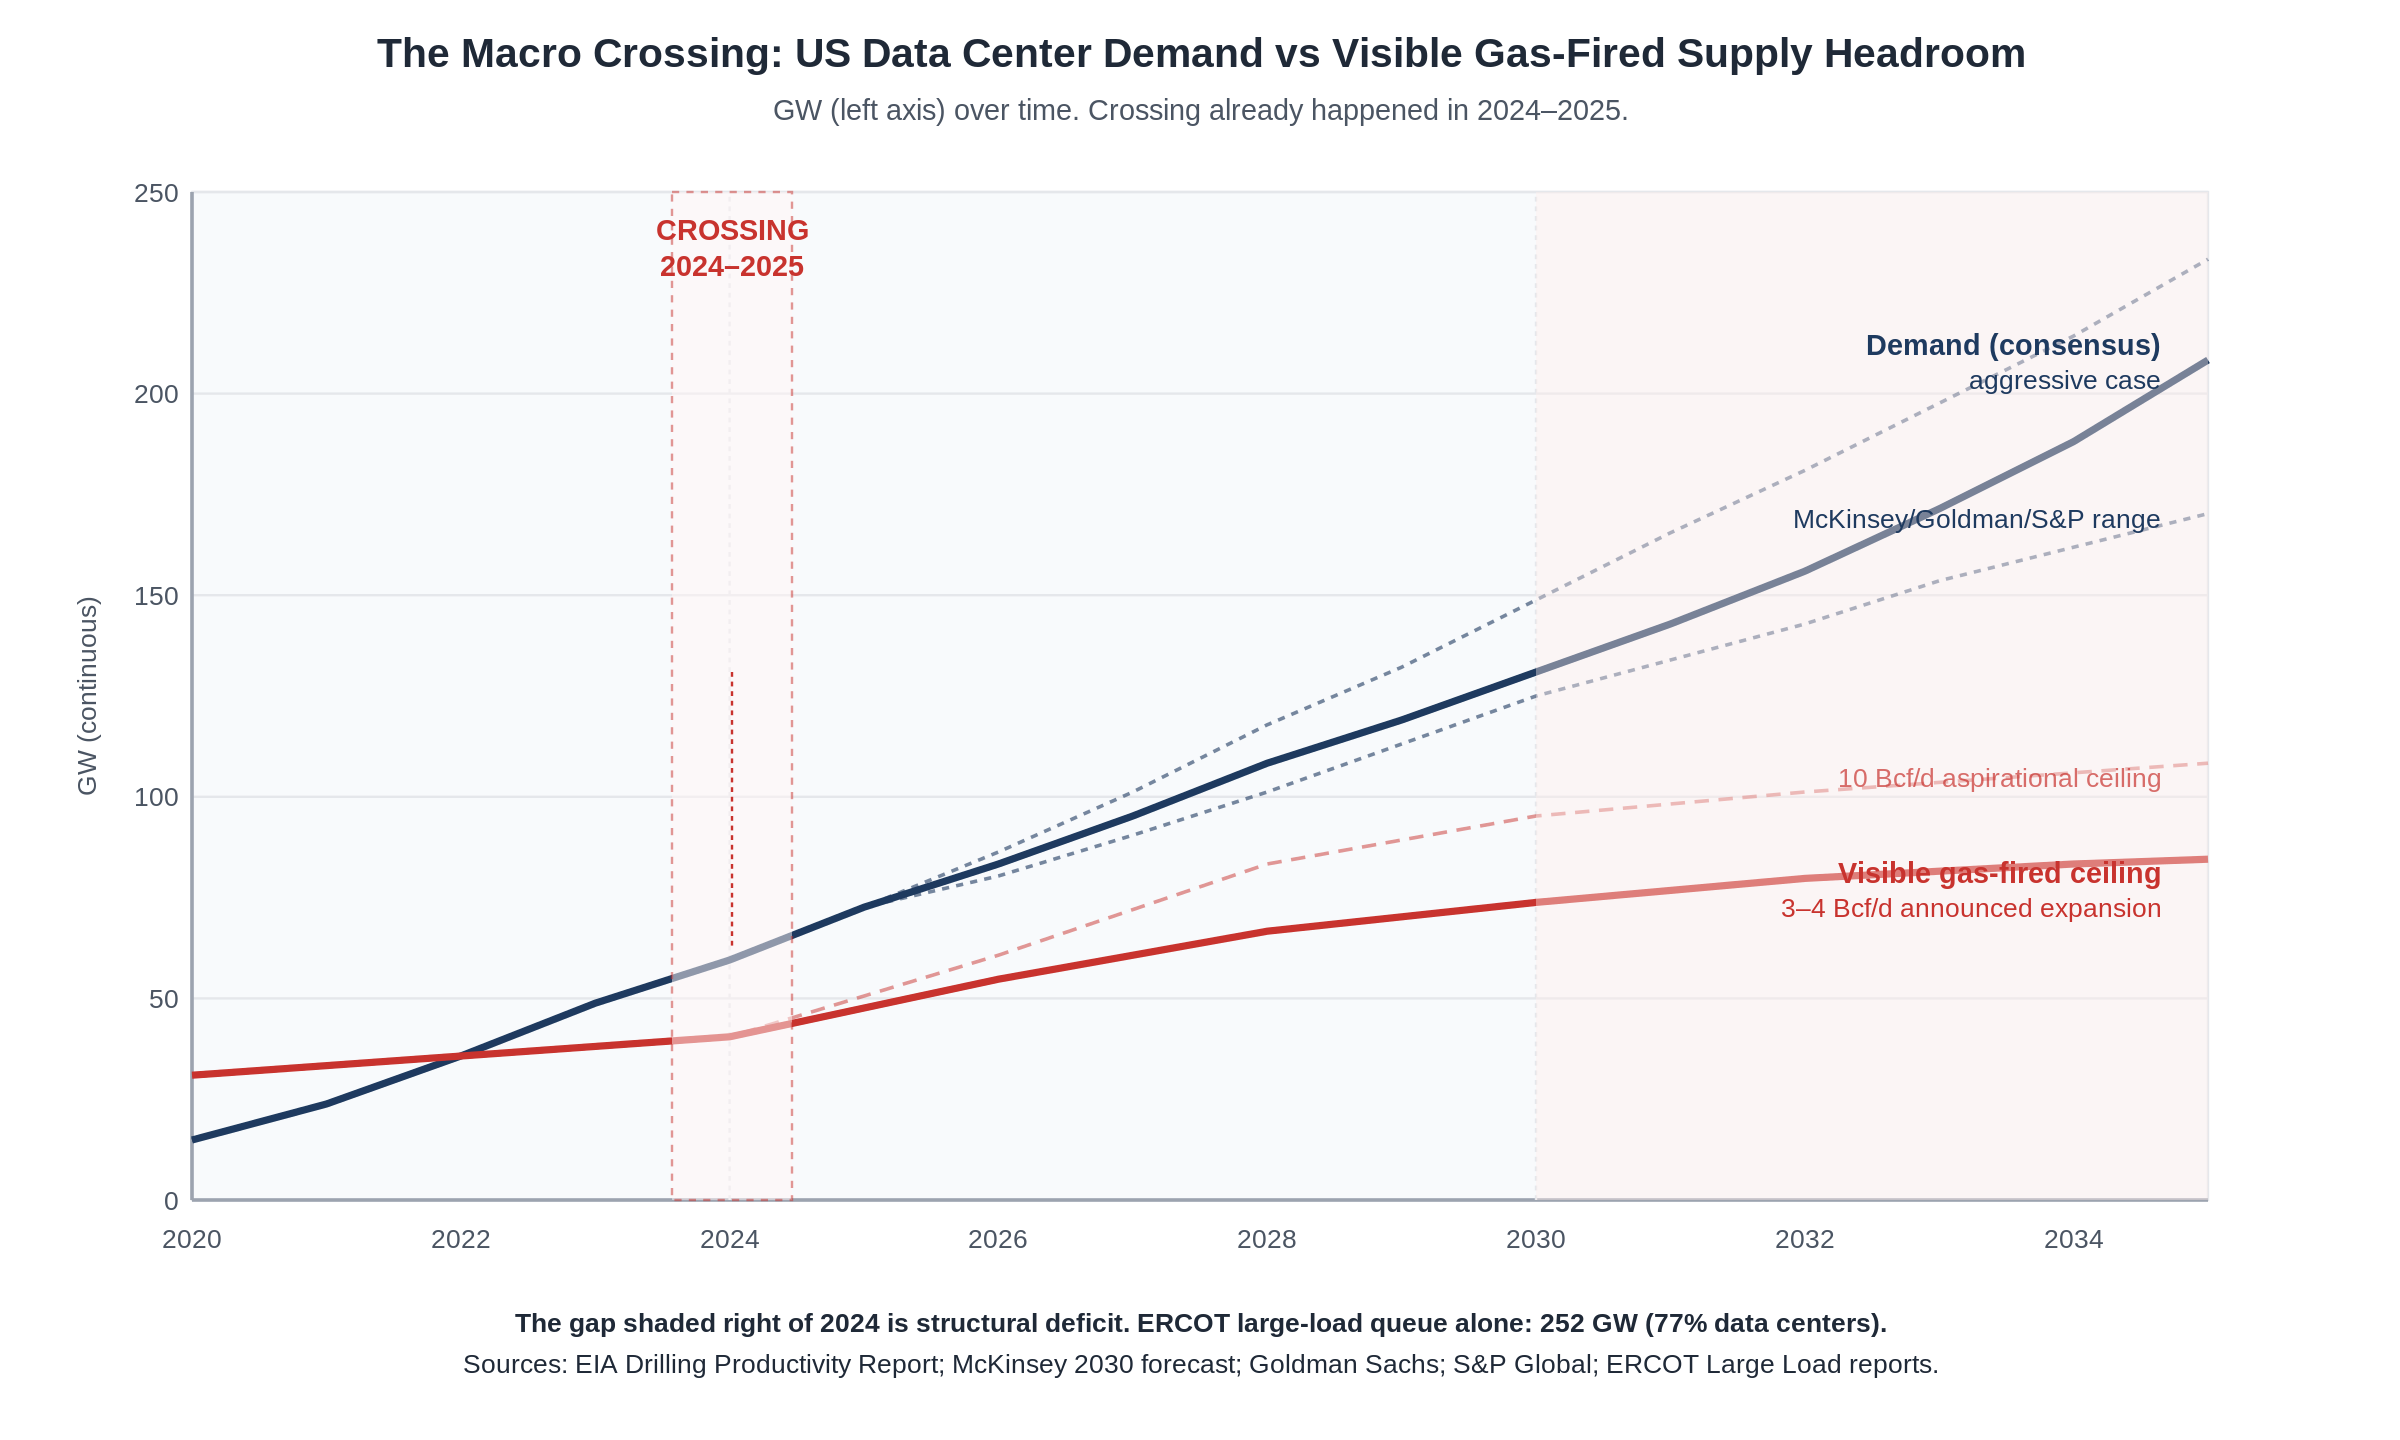
The United States has already crossed the point where data center power demand exceeds visible new gas-fired supply.
The numbers, validated against EIA, McKinsey, Goldman Sachs, S&P Global, and ERCOT filings. Confidence levels and the logic behind each estimate are stated explicitly so the reader can stress-test the assumptions:
US natural gas production: ~118 Bcf/d total in 2025, three top basins ~79 Bcf/d (Marcellus/Utica 36.6, Permian 27.7, Haynesville 14.9). Confidence: high (EIA reported).
Gas-fired supply headroom for new data center load through 2030: announced 3-4 / realistic 5-8 / theoretical 10+ Bcf/d (~19-25 / 32-50 / 63+ GW equivalent). The realistic 5-8 Bcf/d (~32-50 GW) is the working assumption for the rest of the doc. Three views, all stated:
Announced floor: 3-4 Bcf/d / ~19-25 GW.Confidence: high. Conservative visible/committed only , counts named, FERC-filed pipeline projects (Mountain Valley Pipeline Boost ~2 Bcf/d 2028, Greene Interconnect ~1 Bcf/d 2028, Boardwalk/Gulf South storage). 2026 is shaping up as the largest US gas pipeline buildout year since 2008 (~18 Bcf/d planned total additions across all sectors per INGAA), with East Daley and similar trackers identifying ~3-6 Bcf/d as the credible DC/power-tied range , the high end of which sits within the "realistic estimate" below. The 25 GW conversion assumes modern combined-cycle efficiency at ~7,000 BTU/kWh, ~49% LHV (1 Bcf/d ≈ 6.3 GW continuous).
Realistic estimate: 5-8 Bcf/d / ~32-50 GW.Confidence: moderate. Builds on the announced floor by adding capacity that is not yet in formal FERC filings but has line of sight: intra-basin gathering and processing additions (compression upgrades, looping that doesn't need new mainline FERC), M&A on existing systems, LNG redirect (if LNG netbacks compress, gas redirects to domestic power), and pre-FERC announced projects. This range is the working assumption for the rest of the doc.
Theoretical ceiling: 10+ Bcf/d / ~63+ GW.Confidence: low. Achievable only with active policy intervention , DOE Section 202(c) emergency orders, FERC fast-tracks, or Trump-administration emergency action. Not currently in market.
Demand:
Current US data center demand: 30-62 GW total electricity load (S&P high, Bloomberg/LBNL low) , this is total power including grid + renewables + existing gas, not pure incremental gas-fired headroom. Confidence: high on operational base, moderate on upper bound.
2030 consensus demand: 70-100 GW (McKinsey, Goldman, S&P). Aggressive end 100+ GW. Confidence: moderate. Forecasts have been revised UP every 6 months for 3 years; could surprise high (more Stargate-class commits) or low (algorithm efficiency, demand normalization).
ERCOT large-load queue: 252 GW as of early 2026, 77% data centers, 4-5 year wait , figure fluctuates with each filing. Confidence: high.
Dominion paused new large-load interconnections through January 2026. PJM closed new interconnection requests for nearly four years. Confidence: high.
The implication: even at the realistic 5-8 Bcf/d estimate (~32-50 GW headroom), demand at 70-100 GW outruns supply by 20-70 GW. The deficit is real across all credible sensitivities. Only at the theoretical 10+ Bcf/d ceiling combined with low-end demand does the gap close , and that requires both supply policy intervention AND demand normalization.
See Deep Dive 22: Assumptions, Confidence Levels, and Sensitivities for full methodology and what changes if any of these assumptions is wrong.
The crossing happened in 2024-2025, early strains binding now, deepest shortfall projected 2027-2028. Demand already exceeds announced incremental supply by 30-40 GW. The market is responding now: queue saturation, behind-the-meter pivots, hyperscaler vertical integration, $4.75B acquisitions of clean-energy developers. The deepest deficit is still ahead, forecast for 2027-2028 when AI training and inference peak against still-constrained physical infrastructure.
Chip efficiency does not save you
Nvidia's GPU progression V100 → A100 → H100 → H200 → B200 has delivered ~9× perf-per-watt over 8 years. Extrapolated to 2030 that's another 2-4×, plus 1.5-2× more from low-precision training (FP8, FP4). Realistic total: 3-8× by 2030. But demand grows ~20-25% annually (front-loaded and lumpy , large hyperscaler commits land in step changes, not smooth curves) and efficiency grows ~30-40% annually on AI workloads. At the aggregate scenario level they roughly cancel; in any specific year they may not (a Stargate-class commit can blow through a year of efficiency gains in one quarter). See Deep Dive 22 Assumption 3 for the hardware × algorithm sensitivity table. Even at 5× efficiency improvement, the gap doesn't close, because the constraint is physical infrastructure (pipelines, transmission, permits, turbine OEMs, EPC labor), not silicon.
Five takeaways
The data center and the power plant run on different clocks, 12-18 months vs 4-7 years. This is the central structural problem.
The 3-year gap is bridged by phased ramp, vertical integration, or utility partnership, every successful project picks one.
The supply ceiling has already been hit, in 2024-2025. ERCOT and PJM are the canaries.
Chip efficiency is not the lever. Physical infrastructure is.
Hyperscalers are now power developers. Google-Intersect at $4.75B is the template. Expect more.
Reference Project
One illustrative scenario, not a universal template. Real projects vary on every dimension: region, scale, off-taker credit, multi-tenant vs single-tenant, and configuration. This reference is the most replicable pattern in market 2026 (1 GW gas + 1 GW DC, ERCOT, single IG hyperscaler, BTM Phase 1 to grid Phase 2). It reflects one configuration of three-stakeholder coordination (DC developer plus IG hyperscaler off-taker plus energy developer with phased ramp). Deep Dive 22 covers sensitivity to alternate scenarios; Deep Dive 30 surveys alternative stakeholder configurations (hyperscaler vertical integration, utility partnership, OEM equipment lease) observed in market 2025-2026.
Comparisons to PJM (Ohio, Pennsylvania) appear where rules differ.
Total power
1,000 MW (1 GW) natural gas-fired
Plant configuration
Phased: fast-deploy modular generators for first power, H-class combined cycle for full 1 GW
Location
ERCOT (Texas)
Operating mode
Behind-the-meter (BTM) during ramp; grid interconnect after full power
First power
2028 (Phase 1, ~250 MW)
Full power
2031 (1,000 MW)
Grid backstop online
2032
Off-taker
Single hyperscale data center, build-to-suit
Off-taker credit
Investment grade (top-tier hyperscaler proxy)
BESS
Co-located, sized for AI ramp (100-500 MWh)
Black start
Required
Renewables overlay
Excluded from base case
The Master Process Visual
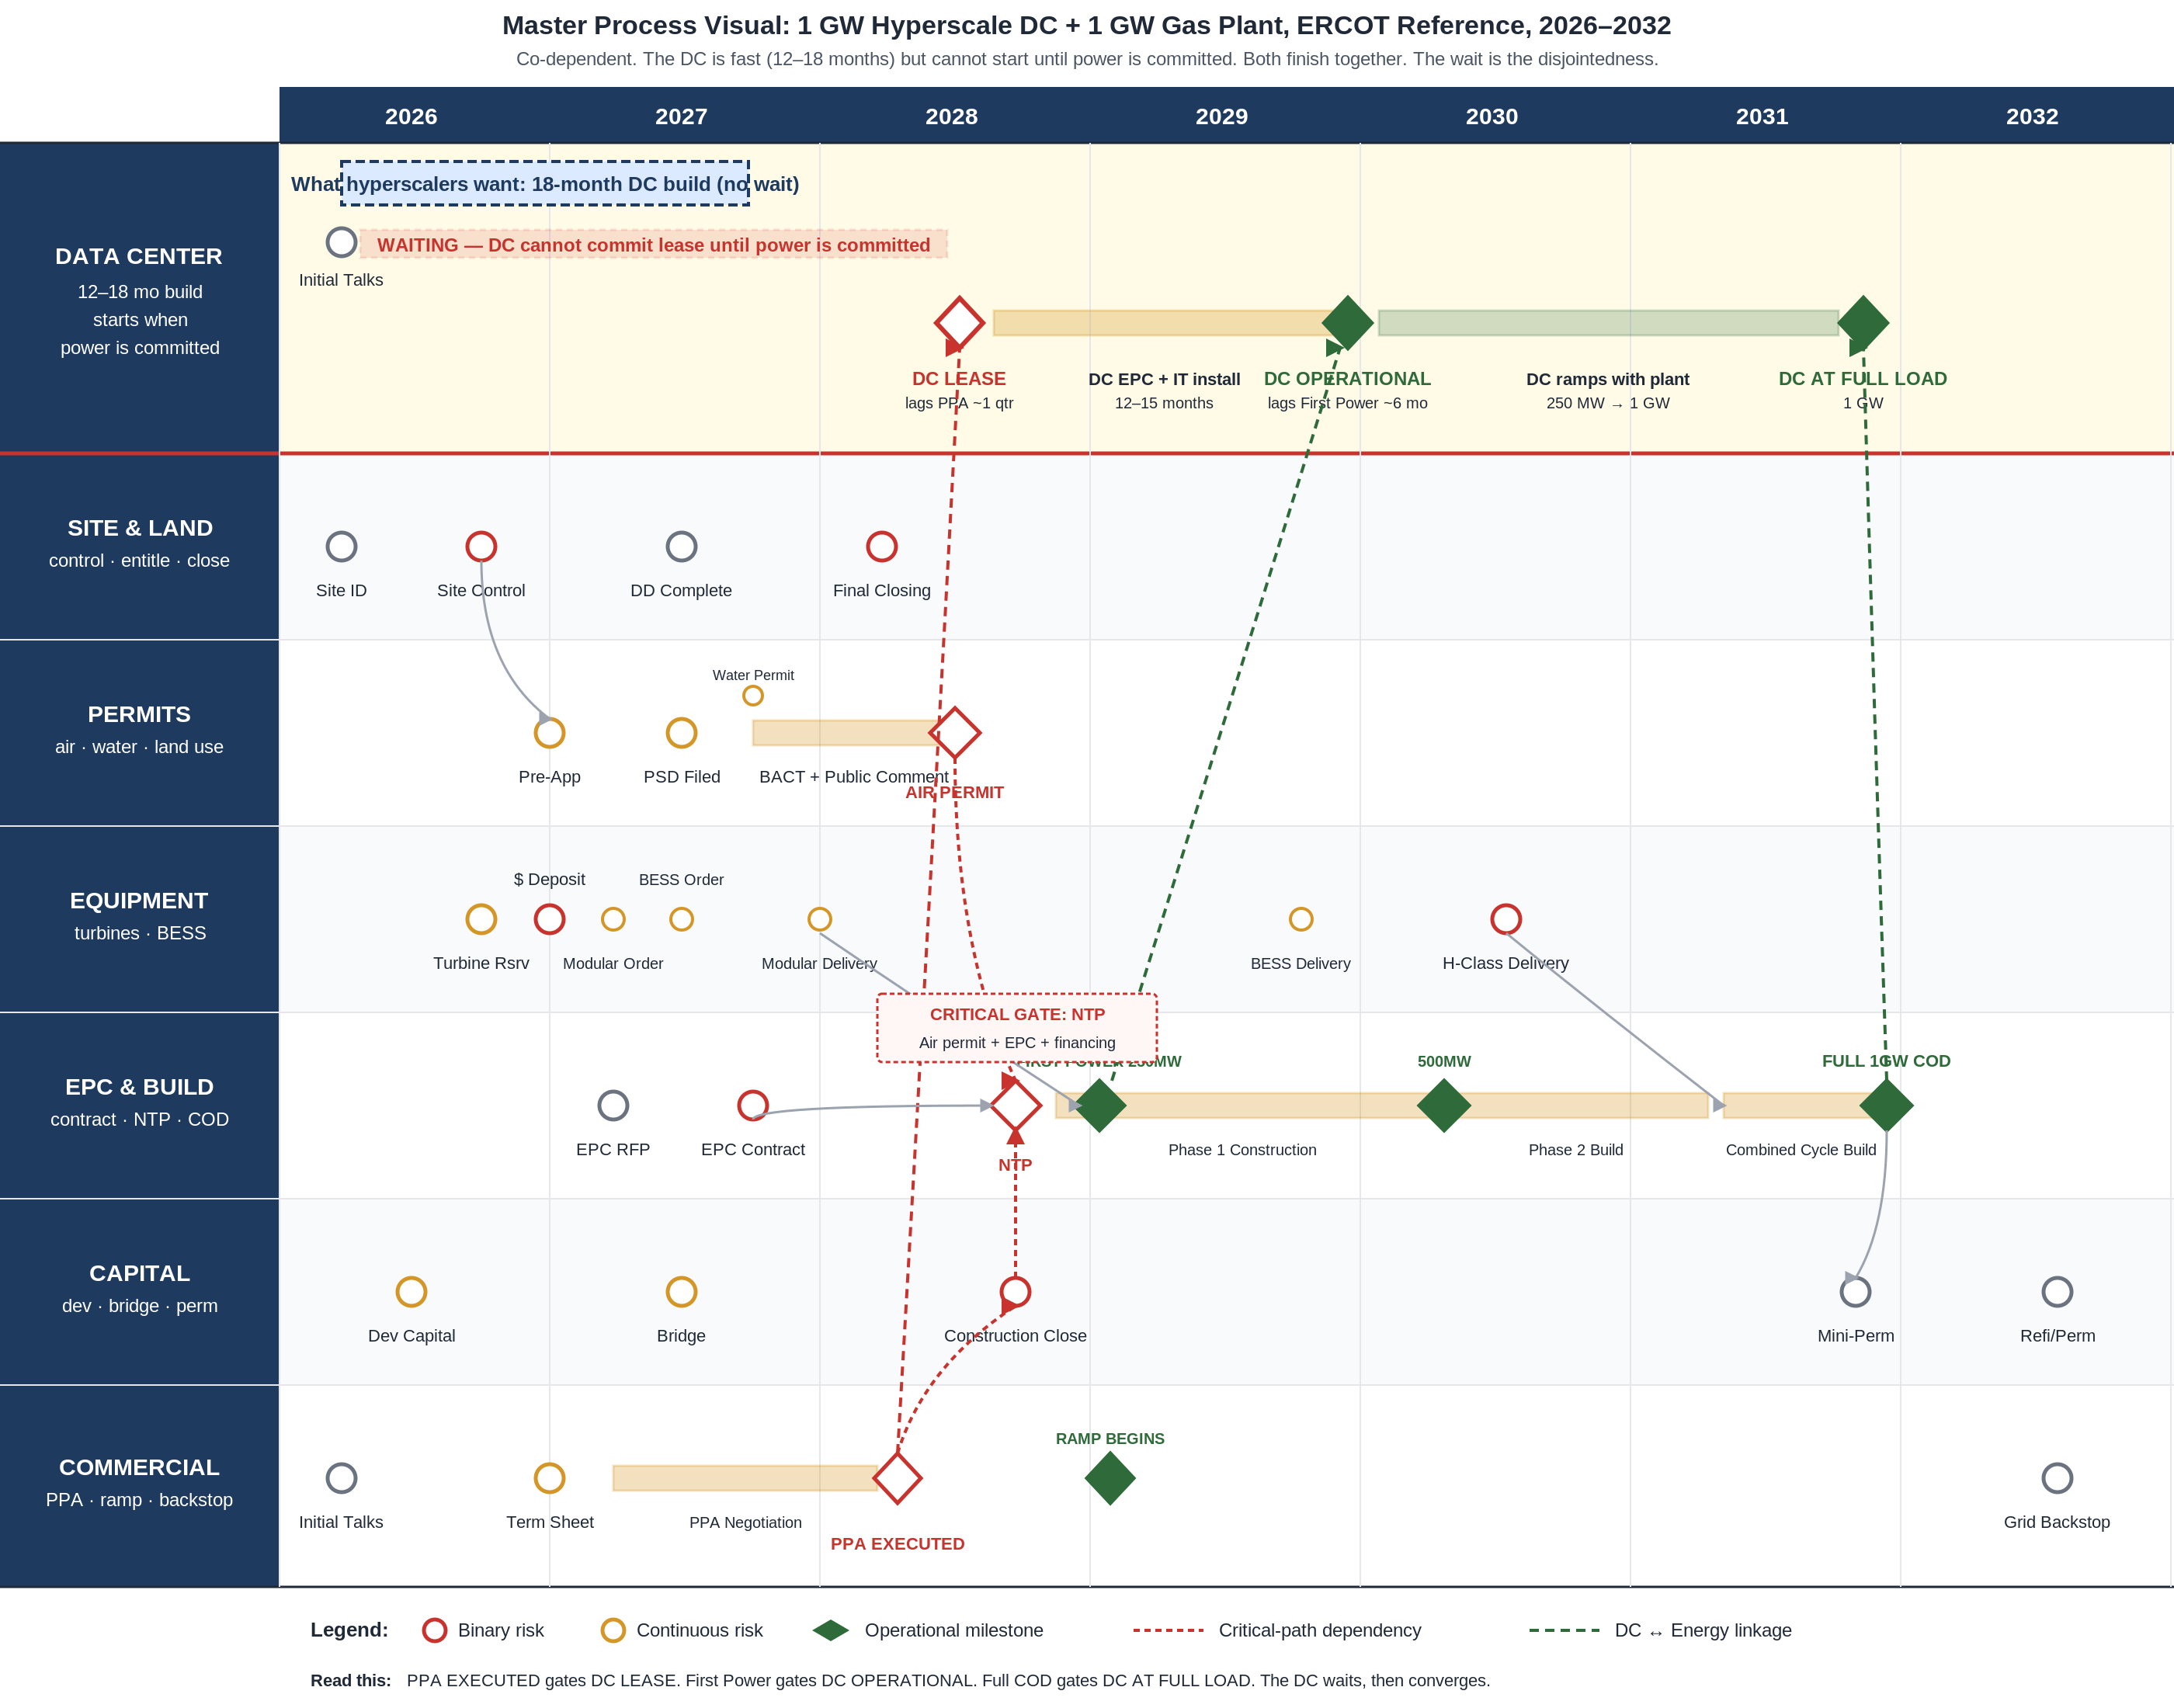
The DC and energy timelines on one page, with every chained dependency marked. Where the project-on-project risk lives.
Seven lanes side by side: a DC overlay lane on top showing the data center timeline, plus six energy plant lanes (Site & Land, Permits, Equipment, EPC & Build, Capital, Commercial). Each milestone is a node. Binary risks are red. Continuous risks are amber. Vertical dashed dependency lines show the gating between energy and DC milestones.
Top yellow lane shows the DC. Six lanes below show the energy plant. Red dashed arrows mark critical-path dependencies. Vertical dependency lines from the energy lanes up to the DC lane show co-dependency: PPA EXECUTED gates DC LEASE, First Power gates DC OPERATIONAL, Full COD gates DC AT FULL LOAD. The "Ghost" overlay at top of the DC lane shows what an 18-month DC build would have looked like if power existed Day 1.
Executive Summary
Thirty cards. One paragraph each. The full risk and design map, scannable in five minutes.
One headline per part of the project. The single most important truth. Click any card to jump to the deep dive.
Each card above expanded with sources. Read the ones that affect your role.
Each section answers the same five questions: What it is, Why it matters, Interdependencies, Risk type and magnitude, Underwriting impact.
01, Three Paths to Power
What it is
Every hyperscale data center needs firm power at gigawatt scale. There are only three ways to get it: build new generation on fresh land (greenfield), convert an existing power plant (often a retiring coal plant or under-used gas peaker), or interconnect through a creative grid arrangement such as co-location with an existing nuclear or gas plant. Most real projects mix two or all three.
Why it matters
Each path has very different economics, timelines, and risk. Greenfield gives you maximum control but takes 4-7 years and carries full permitting risk. Conversion is faster (18-30 months) and uses existing infrastructure but is constrained by what the original site allows. Co-location can deliver power in under 18 months but is exposed to evolving FERC rules. The Amazon-Talen Susquehanna deal had to restructure into a "front-of-meter" framework in spring 2026 after FERC challenged the original co-location structure.
Interdependencies
The path you choose drives air permitting (greenfield needs full PSD; conversion may reuse a permit; co-location may avoid new air permits entirely), capital stack (greenfield holds dev capital at risk longest), and off-take credit (co-location with IG-rated operators like Constellation or Talen commands better terms than an independent producer).
Risk
Mixed. Greenfield carries binary permitting and continuous supply chain risk. Conversion carries existing-asset condition risk. Co-location carries binary regulatory shift risk, the FERC December 2025 colocation order is still being implemented. Magnitude: choosing the wrong path can add 2-5 years and $500M+ to total cost.
Underwriting impact
Greenfield gas requires the deepest dev-capital discipline (5-10% of total cost held at risk for 24-36 months). Conversion projects often qualify for refurbishment financing with shorter dev periods. Co-location debt sizing depends almost entirely on the existing generator's IG credit rating.
The longer-term mix: nuclear, renewables-plus-storage, hybrids
Gas-fired generation is the dominant near-term path because of build-time advantages. The firm-power mix is anticipated to evolve through 2030-2035 with material contribution from non-gas sources:
Nuclear restart and SMRs. Existing US nuclear is ~95 GW operating; 5-8 GW of additional restart potential by 2030 (Three Mile Island via Constellation-Microsoft, Palisades, Diablo Canyon and similar), subject to NRC approvals and ISO interconnection timing. SMR deployment (Kairos, X-energy, TerraPower, NuScale, GE Vernova BWRX-300) is forecast in industry analysis at 10-30 GW US potential by 2030, contingent on lead deployments hitting milestones in 2026-2028. Confidence: moderate on nuclear restart timing; low on SMR delivery dates given historical slippage.
Renewables-plus-storage at firm-power scale. Solar and wind plus 4-8 hour battery storage do not deliver 24×7 firm power equivalent to gas or nuclear for AI training loads, but can supply meaningful capacity for inference workloads, grid backfill, and partial offset. Industry analysis (NREL, BNEF) suggests storage durations need to extend to 8-12 hours plus to compete on firm-power economics, which is a 2028-2032 horizon. Confidence: high on near-term limitations; moderate on long-duration storage trajectory.
Hybrid configurations. The dominant emerging pattern: gas as anchor firm power, with solar-plus-storage providing offset and capacity-market participation, plus nuclear or SMR as longer-term replacement of the gas baseload. Reference projects: Meta Richland Parish (Entergy gas anchor with renewable offset); Microsoft / Constellation TMI restart (nuclear replacing gas in the firm baseload role); Google / Kairos SMR (early-stage nuclear development as part of a longer-term mix). Confidence: high on the directional trend; moderate on specific deployment economics.
A site is not a piece of land. A site is the combination of six dimensions that have to all line up at the same place. The site qualification checklist below mirrors a standard internal diligence framework used in the field today.
1. Development timing. Anchor everything to one date, the expected online date for the data center. Every other answer is graded against whether it can land by that date.
2. Land.
Is the land secured (ownership, lease, or option)?
Expected purchase price.
Acres available for development.
Flood, hurricane, or tornado risk zones.
Zoned for data center use.
Right-of-way permits or easements required to bring resources to the site.
Driving distance to key urban hubs.
3. Power (electricity).
Megawatts available today.
Expected online date for power if not yet available.
Existing electrical infrastructure on or near the site (substations, transmission lines).
4. Fiber.
Existing fiber connections on site.
Nearby fiber providers and approximate distance to connect.
Fiber density of key providers in the area.
Expected timeline to fiber connectivity.
Fiber routes from the site (which cities reachable, with what latency).
Fiber is fatal if missing. Without sufficient lit fiber to multiple major hubs, no hyperscaler will lease the data center, which means no off-taker for the energy plant. The site dies on this criterion alone.
5. Water.
Millions of gallons per day available.
Source mix: groundwater, surface water, or third-party providers.
If additional water is required, are the permits secured.
6. Gas.
Megawatts of prime power the site can support given current gas capacity.
Whether development work is required to bring gas to the site (lateral build, header tap).
Gas provider and expected gas price.
Proposed generation technology (turbine class, simple or combined cycle).
Timeline to install generation.
Whether emissions permits are secured for a prime power solution.
Why it matters
A great site solves 80% of the rest of the project. The wrong site multiplies every downstream problem. Recent examples: Pittsylvania County, Virginia killed a hyperscale gas project at the rezoning stage in 2025, costing $500M+ in foregone investment. Montour County, Pennsylvania rejected a co-location rezoning the same year. ERCOT projects in Pecos County have unlocked the Permian gas advantage for projects that picked the right basin proximity. The site decides what's possible.
Interdependencies
Site selection feeds every other decision. Air permit pathway is determined by airshed, attainment status, and proximity to environmental justice communities. Gas access is set by basin proximity and existing pipeline laterals. Water decides cooling design. Power and fiber decide whether a hyperscale tenant can use the site at all. Land control is the gating event for every permit application.
Risk
Binary on each of the six dimensions. Magnitude: any single missing piece is fatal. Mitigation: run the full six-dimension intake checklist in parallel for every candidate site before any capital deploys. This is the entitlement-first approach.
Underwriting impact
Site control is the gate that unlocks development capital. Without it, no lender or sponsor commits real money. Dev capital deployed before site control is fully at risk and rarely recoverable.
A 1 GW gas plant emits enough nitrogen oxides, carbon monoxide, and other pollutants to trigger Prevention of Significant Deterioration (PSD) Major Source review under the Clean Air Act. PSD requires a Best Available Control Technology (BACT) determination, an air quality impact analysis, and a public comment period. Once the air permit is issued, the plant also needs a Title V Operating Permit. State agencies run the process: TCEQ in Texas, Ohio EPA in Ohio, PA DEP in Pennsylvania.
Why it matters
Air permits are the single most likely point of total project failure. Best case for a 1 GW plant is 18-30 months. Worst case is 36-60+ months when community opposition or environmental justice review extends the process. xAI Memphis ran for months with 35 unpermitted gas turbines and faced a NAACP lawsuit before getting a permit for only 15 of them. Meta Apollo in Ohio used the OPSB expedited "letter of notification" pathway to compress to ~18 months. The permit is binary, it issues, or the project dies.
Modular strategy
Some projects break the plant into 200-300 MW modules under minor source NSR, which permits in 6-12 months per module. VoltaGrid's QPac platform has done this with stackable reciprocating engines. The catch: TCEQ and Ohio EPA aggregate emissions across modules at a single site if they share infrastructure, which kicks the project back to major source. Legal review before committing to this path is non-optional.
Interdependencies
Air permit timing drives NTP (no construction without permit), which drives EPC mobilization, which drives construction financing close, which drives first power. A 12-month permit slip slides every one of these by 12 months.
Risk
Binary. Magnitude: project-ending if denied. Mitigation: entitlement-first site selection, early community engagement, low-NOx burner specs at filing, third-party air quality baseline studies. Environmental justice screening (EPA's EJScreen) within a 3-mile radius can add 6-18 months.
Underwriting impact
Lenders will not close construction financing without a final, non-appealable air permit. Dev capital deployed before permit issuance is at full risk.
A 1 GW combined cycle plant burns roughly 150,000 MMBtu per day at full output, about 150 million cubic feet of gas a day. The gas has to come from somewhere, interstate pipeline, intrastate pipeline, or a new lateral built off a nearby header. Firm transport contracts (not interruptible) are required so the plant doesn't get cut off in winter.
Why it matters
A gas plant without firm gas is a paperweight. ERCOT projects sit on top of cheap Permian, Eagle Ford, and Haynesville gas, Pacifico's 7.65 GW GW Ranch in Pecos County could consume 1-2 Bcf per day, equivalent to 4-7% of 2025 Permian production. PJM projects in Ohio and Pennsylvania sit on top of Marcellus and Utica. Both basins are abundant, but pipeline expansion to a specific site can take 18-36 months and one easement holder can stop the whole project. TC Energy's open season in late 2025 for 1.2+ Bcf/d of Ohio capacity drew immediate hyperscale interest.
Interdependencies
Gas access is part of site selection. The plant's heat rate and capacity payment economics assume firm gas at a specific price. If the lateral build slips, plant COD slips. If the gas contract is interruptible instead of firm, lenders will not size the debt to peak output.
Risk
Continuous on lateral build (timing and cost), binary on easement holdouts. Magnitude: 12-24 month delay if a major pipeline component slips, $50-200M cost adders. Mitigation: select sites with existing pipeline access in place, sign firm transport contracts at financial close, build in redundant header connections where possible.
Underwriting impact
Lenders model gas cost as a pass-through under tolling agreements (off-taker pays fuel) but require firm transport to be in place at financial close. Gas price volatility itself is not the project's risk, the off-taker eats it. The risk is physical delivery.
Major US pipeline operators in the relevant corridors
Williams (Transco) operates the largest US gas pipeline system, with multiple expansions across Marcellus-to-mid-Atlantic and Gulf Coast corridors. Energy Transfer is the dominant Permian and Gulf Coast intrastate operator. Kinder Morgan operates Permian Highway and Gulf Coast Express plus brownfield expansions in DC-tied corridors. TC Energy ran an active 1.2+ Bcf/d Ohio open season for Marcellus/Utica-to-PJM throughput and is developing the NEXUS pipeline expansion path. Adjacent gathering, processing, and storage operators (MPLX, Enbridge, Boardwalk, Columbia Gulf) round out the relevant infrastructure stack. Industry trackers (East Daley, Arbo/NGI, INGAA) identify ~3-6 Bcf/d as the credible DC-tied pipeline range through 2028, growing to ~5-8 Bcf/d realistically when intra-basin gathering and pre-FERC announced projects are included.
A gas turbine takes in air, mixes it with gas, burns it, and spins a shaft that drives a generator. Three classes matter for a 1 GW project. Aero turbines (GE LM6000, LM2500) are derived from jet engines, small, fast-ramping, expensive per kW, used for peaking. F-class turbines (GE 7F, Mitsubishi M501F, Siemens SGT-750) are mid-range workhorses, 45-50% efficient in combined cycle. H-class turbines (GE 7HA, Mitsubishi M501JAC, Siemens SGT5-9000HL) are the largest and most efficient, 50-64% in combined cycle, lower NOx, hydrogen-ready, and the default choice for new 1 GW builds.
Why it matters
Lead times for new H-class orders are now 5-7 years. GE Vernova has 80 GW of backlog plus reservation agreements as of end-2025. Siemens Energy is sold out through 2030. Mitsubishi is sold out through 2028. Reservation deposits, paying just to hold a delivery slot, are now $50-150M per unit and 10-20% of capex. For a 1 GW project (typically 9 H-class units in combined cycle) that's $500M-$1.5B in deposits before construction starts.
Modular reciprocating fallback
Because H-class lead times are so long, fast-deploy projects use modular reciprocating engines (Wärtsilä, Caterpillar, INNIO) for first power. Oracle Shackelford uses 210 industrial gas generators on the VoltaGrid platform. Meta El Paso uses 366 MW of modular Caterpillar units. xAI Memphis runs 27 turbines in a modular configuration. These are smaller per unit but stackable, deploy in months instead of years, and bridge the timeline until H-class arrives for the combined cycle phase.
Interdependencies
Turbine selection drives air permit content (BACT depends on the chosen technology), plant footprint, gas demand, water demand, and capex. The order date drives delivery, which drives mechanical completion, which drives first fire and COD.
Risk
Continuous on lead time and price, binary on OEM solvency or geopolitical disruption. Magnitude: 12-36 month delay if OEM allocation slips, $100M+ capex variance.
Underwriting impact
Lenders require executed equipment contracts and paid deposits before construction financing close. Late-cycle slot-poaching (buying someone else's reservation at a markup) is now a real cost line.
A Battery Energy Storage System sits between the power plant and the data center load. It absorbs sub-second power swings that the gas turbines cannot follow. Lithium-ion is the standard chemistry. For a 1 GW AI campus, sizing typically falls in the 100-500 MWh range, costing $300-600 per kWh, or $150-300M for a 500 MWh system.
Why it matters
AI training workloads are nothing like traditional data center loads. During checkpointing, the periodic save-state of a training run, power demand can swing by 20-50% of peak in seconds. H-class gas turbines ramp at 10-20 MW/min. They cannot follow a 500 MW spike that arrives in under a second. Without BESS, grid frequency drops, the plant trips, the training run dies. BESS bridges the gap. Some campuses also add supercapacitors for the fastest transients (under 100 ms), with the BESS handling 1-10 minute smoothing and the turbines handling sustained load.
Interdependencies
BESS sizing depends on training workload profile (talked through with the hyperscaler at lease design), turbine ramp capability, and whether the plant runs islanded. Black start capability also depends on BESS being charged. BESS placement (data center side vs plant side) affects interconnection and metering.
Risk
Continuous on cost, supply chain, and degradation. Lithium-ion BESS lose roughly 2% capacity per year and need replacement at 10-15 years. Magnitude: under-sized BESS results in plant trips and lost compute revenue; over-sized BESS is wasted capex.
Underwriting impact
BESS is line-itemed in the project capex budget. Lenders treat BESS as integrated infrastructure for behind-the-meter projects. In PJM, BESS qualifies for capacity payments where standalone gas behind-the-meter does not, making BESS placement a revenue-stack decision, not just a technical one.
Black start is the ability to start the power plant from zero, no help from the grid, no outside power. A small synchronous generator (typically 50-100 MW, sometimes a diesel set, sometimes an aero turbine) fires up, stabilizes voltage and frequency on the local island, then starts the larger gas turbines and BESS. Once the plant is humming, it can carry the data center load.
Why it matters
Behind-the-meter data centers run islanded for years before grid interconnect comes online. If the plant trips during operation, equipment failure, fuel disruption, weather, there is no grid to fall back on. Black start is the only way to recover. For the reference project, the plant runs BTM from 2028 to 2032, four years where black start is the only recovery path. Once grid backstop is live, the grid can do the work, but black start capability typically stays in place as a redundancy.
Interdependencies
Black start design integrates with BESS (used to stabilize during ramping), control systems (the sequence has to be modeled and validated), and EPC scope (the small starter set is procured and commissioned alongside the main equipment). Validation simulations typically take 3-6 months.
Risk
Continuous on design and validation. Magnitude: small in capex terms (well under 5% of plant cost) but binary on operational risk, without it, a single trip can take the data center offline for hours or days. Siemens Energy won the first US black-start battery storage project in 2025.
Underwriting impact
Lenders require demonstrated black start capability for any BTM project before construction financing close. It's a checklist item but a non-waivable one.
A gas-fired power plant runs in one of two modes. Simple cycle (also called open cycle) burns gas in a turbine, spins a generator, and vents the exhaust. Combined cycle adds a heat recovery steam generator that captures the exhaust heat to drive a steam turbine, the same fuel produces 30-40% more electricity. Simple cycle is 35-40% efficient. Combined cycle is 50-64% efficient.
Why it matters
Simple cycle is faster to build (18-24 months) and cheaper per kW ($600-900). Combined cycle takes 36-48 months and costs more ($800-1,200 per kW, plus the steam cycle adds another $300-500 per kW), but burns about a third less gas for the same power. For a 1 GW plant running base load, combined cycle saves enough on fuel to pay for itself many times over its life. The dominant 1 GW pattern for hyperscale: simple cycle for first power, then add the steam cycle on top. This gets first MW to the data center 18-24 months earlier and lets the steam tail come online once the combined cycle equipment arrives.
Interdependencies
Plant configuration drives air permit emissions profile (combined cycle has lower per-MWh emissions, easier BACT), water demand (combined cycle needs more cooling water for the steam loop), capex profile (phased), turbine selection (H-class preferred for combined cycle), and project timeline.
Risk
Mixed. Simple cycle alone leaves efficiency on the table for a base-load hyperscale tenant. Combined cycle alone delays first power. Phased build is the dominant pattern but adds construction sequencing complexity. Magnitude: choosing wrong adds 18-24 months or 30%+ to lifetime fuel cost.
Underwriting impact
Phased build allows phased financing, Phase 1 simple cycle gets to revenue faster, supporting Phase 2 combined cycle financing. Modular reciprocating engines are an even faster Phase 1 alternative when H-class lead times bind.
EPC stands for Engineering, Procurement, and Construction. The EPC contractor designs the plant, buys the equipment, and builds it. Major firms in the hyperscale + power space: Bechtel, Kiewit, Fluor, Black & Veatch, Burns & McDonnell. Bechtel and Kiewit are working together on the $33B Ohio PORTS project. Kiewit is building Homer City's record 4.5 GW gas plant in Pennsylvania.
Why it matters
Two things are true at once. First, the major EPCs are oversubscribed, 12-18 month delays just to lock an EPC selection in 2026. Second, US craft labor is short by 350,000-500,000 workers nationally, with electricians, pipefitters, welders, and HVAC techs the most constrained. Even with money, permits, and equipment, finding the people to build the plant can add 6-12 months. Wage premiums are 10-25% above 2024 baselines for critical trades.
Contract structures
Pure lump-sum turnkey (LSTK) is dying. EPCs will not absorb full cost and schedule risk on megaprojects in this market. Hybrid structures dominate: phased lump-sum (LSTK on engineering and procurement, reimbursable on construction), target price with pain-gain (50/50 share above and below an agreed cost target), or EPCM where the EPC manages but the owner carries direct labor and material costs.
Interdependencies
EPC contract type drives risk allocation across the project and how lenders size construction debt. EPC mobilization depends on long-lead procurement (turbines, switchgear) being secured. EPC labor competes with every other megaproject in the region.
Risk
Continuous on schedule, cost, and labor. Magnitude: 6-12 months on labor, $50-200M on cost overruns at the project scale. Mitigation: lock EPC early (12-18 months pre-NTP), pre-negotiate craft labor agreements, use modular prefabrication where possible.
Underwriting impact
Lenders require executed EPC contract before construction financing close. Hybrid structures require larger contingency reserves (10-15% vs 5-8% for true LSTK). Owner-side cost risk has shifted up.
The off-take agreement is the contract between the power plant and the data center tenant. It comes in two main forms. A Power Purchase Agreement (PPA) sells energy at a fixed or indexed price. A tolling agreement charges a fixed capacity payment plus pass-through fuel, the off-taker provides the gas, the plant converts it. For behind-the-meter co-located projects, tolling is preferred because it aligns the tenant's fuel risk with their compute economics.
Why it matters
The off-take agreement is the project. Without a 15-20 year credit-backed contract to an investment-grade tenant, the project does not get financed. An IG-rated hyperscaler (Google, Meta, AWS, Microsoft) enables 60-65% project debt. Sub-IG counterparties cut leverage to 45-55% and require parent guarantees or letters of credit equal to 12-24 months of fixed payments. Non-rated counterparties typically cannot finance project debt at all without third-party credit support.
Term mismatch problem
A typical hyperscale data center build-to-suit lease runs 15 years. A typical gas plant PPA runs 20 years. When they don't match, the project hits a refinancing cliff at year 15, the lease expires, the energy debt still has 5 years to run, and lender collateral value drops 30-50%. Three solutions exist: extend the DC lease to 20 years (most common today), separate the financing books for DC and energy, or pool both into a single tranched ABS. None is dominant; the market is still solving this. Underlying issue: residual value beyond the initial lease period is speculative in frontier markets at hyperscale (no proven re-leasing market at GW scale outside core hubs). See Deep Dive 11 for the residual value debate, the disciplined position is to underwrite IRR within the initial lease and treat residual as upside, especially in frontier markets.
Interdependencies
Off-take credit drives debt sizing on both DC and energy. Off-take tenor must match financing tenor. Off-take volume commitment ("all-or-nearly-all" 90-95% capacity) drives revenue certainty. Take-or-pay floors protect against tenant ramp delays.
Risk
Cliff risk. Off-taker default is low probability with IG tenants but project-ending if it hits. Magnitude: full project at risk. Mitigation: term matching, parent guarantees, take-or-pay minimums, standby letters of credit.
Underwriting impact
Off-take credit IS the energy project debt collateral, not the plant. The plant has no merchant market in BTM mode; if the tenant exits, the asset is stranded. Off-taker credit quality cascades across all three stakeholders (DC developer, hyperscaler, energy developer) and is the central link enabling each party to size debt against the same counterparty. See Deep Dive 30 for how off-take credit feeds into cross-stakeholder capital optimization.
The capital stack is who puts money in and on what terms. For a 1 GW gas plant under tolling agreement, the typical stack is 30-40% sponsor equity, 55-65% senior secured project debt, and (rarely) 0-10% mezzanine. Debt tenor matches PPA tenor, 15-20 years. Senior debt is sized to a minimum debt service coverage ratio (DSCR) of 1.30-1.40x. Tolling structures get slightly more aggressive sizing (1.25-1.30x) because off-taker credit absorbs fuel and dispatch risk.
Why it matters
The numbers determine what's possible. Energy infra: unlevered IRR on a stabilized tolling plant with an IG off-taker runs 8-12%. Levered IRR for sponsor equity runs 14-18%. DC developer: hyperscale build-to-suit development IRRs run 25-40% during the dev period (3-4 year hold), stepping down to 8-10% at stabilization, with stack of 25-35% sponsor equity, 50-60% construction debt, replaced by 50-60% LTV permanent debt at COD. Recent comps support these ranges: Macquarie put $112.5M of preferred equity into Applied Digital's Polaris Forge alongside $277.5M of APLD sponsor equity, implying ~40% blended equity and ~60% debt.
Sub-IG impact
Investment-grade off-take enables max leverage. Sub-IG cuts sponsor equity from 30% to 40-45% and adds 150-250 bps to all-in cost of capital.
The residual value debate
A real point of commercial tension that the doc should not duck: should DC developers underwrite the lease to deliver target return in the initial lease period (15 years), or rely on residual value (renewal, sale, repurpose) to hit the IRR? Two views in market.
The traditional view, residual is real. Hyperscale build-to-suit reaches stabilization in 3-4 years (developer-flip exit captures 25-40% dev IRR), and long-term holders earn 9-11% YoC over 9-11 years (full cash payback). Re-leasing markets in core hubs (Northern Virginia, Dallas, Phoenix) support 80-90% of original rent on renewal. Underwriting to residual is defensible.
The disciplined view, residual is speculation in frontier markets. At gigawatt scale in West Texas, Wyoming, the Permian, or rural ERCOT, there is no proven re-leasing market. If the hyperscaler walks at year 15, the asset sits idle. The right target is to deliver the IRR in the initial lease period and treat residual as upside, not baseline. This pushes minimum YoC at frontier sites to 9.5-10.5% rather than the 8-9% being accepted in some recent deals. Lower yields on frontier mega-sites ride on the assumption that hyperscale demand will persist beyond the initial lease, and that's not a contracted assumption.
The energy developer's logic applies: never underwrite to a merchant tail you don't control. Same principle should govern DC underwriting in markets without proven secondary demand. Core markets with IG triple-net off-take can defensibly accept lower YoC because the residual is real. Frontier sites at scale cannot. The recent industry pattern of accepting 8-9% YoC at frontier mega-sites is taking on more residual risk than the underlying market has proven out.
Interdependencies
Off-take credit drives debt sizing. EPC contract type drives contingency reserves. Permits drive financial close timing. Turbine deposits eat working capital before debt is even drawn.
Risk
Mixed. Underwriting risk lives in the assumptions, DSCR holds only if revenue holds, which holds only if off-taker performs.
Underwriting impact
Lenders model 15-20 year base case with stress scenarios on heat rate, availability, and off-taker ramp delays. Construction debt rolls to permanent at COD; mini-perm structures (5-7 year tenor with refinance) are common as a bridge.
Conditions precedent (CPs) and project-on-project risk
The underlying problem is a 3-year capital gap before bankability. Firm transport precedent agreements and turbine reservation deposits ($600M to $2B for a 1 GW project) typically have to be committed 24 to 36 months before a hyperscaler PPA can be executed. Project finance debt cannot fund any of this because lenders require an investment-grade off-take commitment to size construction debt. The result is that dev-stage capital is 100% at-risk equity for 24 to 36 months. The CPs below are the standard list lenders use to test whether the project is ready to close; the mitigation toolkit further down is the standard toolkit sponsors use to manage the dev-stage capital exposure.
Energy project finance closes only when a defined list of CPs are all satisfied. Standard CPs for a 1 GW gas plant:
Final and non-appealable air permit (PSD major source or minor source NSR)
Executed EPC contract with bonding and warranties from a Tier 1 contractor
Executed PPA or tolling agreement with an investment-grade off-taker
Executed gas supply agreement
Executed firm transport agreement (or precedent agreement with a major pipeline)
Turbine reservation deposits paid; mechanical completion date secured
Generator interconnection agreement (where required for first power, see Deep Dive 23)
Land control documents (deed or long-term lease)
All material regulatory approvals (water, county/state environmental, FERC, other)
Sponsor equity committed and funded into escrow
Insurance bound (construction all-risk, delayed startup, marine cargo where applicable)
Independent engineer report and lender's technical advisor sign-off
Each CP is binary. Missing one delays financial close, which delays construction debt, which delays NTP, which delays first power.
When the energy plant and the data center are co-located but separately financed, each side's CP chain depends on the other side's progress. The energy plant cannot close without an investment-grade off-taker (the DC tenant). The DC cannot commit to a fixed compute-online date without certified power delivery (the energy plant). Both CP chains have to land in parallel, and a slip on either side cascades. This is the project-on-project risk.
Specific cascading failure modes:
DC tenant pushback on PPA price reduces off-take credit, which reduces energy debt size, which opens a sponsor equity gap and stalls the project.
Air permit appeal at 11 months into the issue period misses the CP; financial close slips 6-12 months; construction debt rolls; interest carry escalates; IRR compresses.
Turbine order cancelled by sponsor (or OEM defaults on delivery date) eliminates mechanical completion; NTP cannot be issued; the DC tenant declares MAC under the offtake agreement.
Mitigation structures. The market has developed a toolkit for managing project-on-project risk: parent guarantees from the hyperscale tenant covering specific obligations; take-or-pay PPAs with damage payments scaled to construction milestones; hyperscaler funding of dev capital (Google/Intersect template at $4.75B); equipment lease structures (Halliburton/INNIO 2.3 GW); escalating LCs at milestones (3-month, 6-month, 12-month); defined-event acceleration clauses with damage payments; completion and performance insurance (limited market, expensive).
Sponsors with strong hyperscaler relationships can shift project-on-project risk back onto the tenant. Sponsors without that leverage carry the risk themselves and price it into IRR targets. Integrated platforms (energy + DC under one sponsor) eliminate project-on-project risk by definition, which is part of why the market is consolidating in that direction. These mitigation structures are practical expressions of the cross-stakeholder capital optimization framework in Deep Dive 30: each is moving a specific risk to the party with lowest cost of bearing it, given their different capital costs and time horizons.
Capital does not arrive all at once. It is released against project milestones. A 1 GW co-located project moves through five financing stages: development capital (5-10% of total cost) for site, entitlements, design, and financing fees; bridge facility for early procurement; construction debt (50-60% of total cost) drawn against hard cost milestones; mini-perm or permanent debt at COD; and refinancing once the asset is stabilized.
Why it matters
Each stage is a separate risk hurdle and a separate financing event. Site control unlocks dev capital. Air permit + executed PPA + executed EPC unlock construction financing close. NTP releases construction debt against drawdowns. Mechanical complete and first fire trigger the next tranche. COD converts construction debt to permanent debt. If any gate slips, the next tranche is held.
Dev capital reality
Dev capital is fully at risk until financial close. For a $2.5B 1 GW gas plant, dev capital is $125-250M held for 24-36 months with no return guarantee. Hyperscalers increasingly pre-fund or guarantee dev-capital reimbursement, which materially de-risks the sponsor, but this is a negotiated outcome, not a market default. This shift from sponsor-funded to hyperscaler-backed dev capital is a direct reflection of the different cost-of-capital across parties (sponsor at 15%+, hyperscaler at near-balance-sheet cost) and is the market's move toward the cross-stakeholder optimization framed in Deep Dive 30.
Promote structure
Sponsors capture upside through promote schedules: typical 15-25% of profits above an agreed hurdle IRR, sometimes with a stepped waterfall (e.g., 20% above 12% IRR, 30% above 18%). For integrated DC + energy projects, promote often covers the whole project on a blended basis.
Interdependencies
Stage-gating ties every other section together. Permits unlock finance unlocks NTP unlocks construction unlocks COD unlocks permanent debt unlocks promote. One stuck gate stops everything.
Risk
Continuous on dev-capital exposure (long timeline, full at risk), binary at each gate (financial close happens or doesn't).
Underwriting impact
Lenders model the full waterfall. Sponsors model the dev-capital deployment curve and the equity check size at each gate.
Risks come in three shapes. Binary risks either pass or kill the project, air permit issued or not, FERC interconnection approved or not, off-taker investment grade or not. Continuous risks can be managed with time and money but always cost something, turbine delivery slip, gas pipeline build, EPC labor shortage, weather. Cliff risks are low probability but project-ending if they hit, off-taker default, EPC default, fuel supply default, regulatory rule change.
Why it matters
Each risk shape needs a different mitigation strategy. Binary risks demand entitlement-first selection (only sites and counterparties that pass). Continuous risks demand contingency time, contingency budget, and parallel paths. Cliff risks demand contractual protections (parent guarantees, LCs, take-or-pay, force majeure provisions).
Magnitude scale
For the reference project: binary risks risk the entire $2.5B+ project. Continuous risks typically cost 5-20% of project budget and 6-18 months of schedule when they materialize. Cliff risks vary, off-taker default is full project loss; EPC default can be replaced (with a 12-24 month delay and 10-20% cost adder).
Risks by stage
Site & Land: binary site control, continuous due diligence findings
Permits: binary air permit, continuous local pushback timeline
Lenders price binary risks as conditions precedent to close (the risk is gone before debt is drawn). Continuous risks are absorbed in contingency reserves and base-case stress tests. Cliff risks require contractual structures, usually parent guarantees, security deposits, or take-or-pay floors.
Sources: Synthesizes risk frameworks from project finance literature, Morgan Lewis, S&P Global, NREL ATB methodology referenced throughout this guide.
14, Regional Comparison: ERCOT vs PJM
ERCOT (Texas)
Speed to power: fastest in the US. Median 4.1 years in queue for batteries; 2.5 years from interconnection agreement to operation. Senate Bill 6 (June 2025) and the upcoming Batch Study process (proposed Feb 2026) add structure but also new disclosure and curtailment rules.
Capacity market: energy-only. There are no capacity payments. Plant revenue depends entirely on volatile real-time energy prices, which lenders penalize.
Behind-the-meter: SB 6 allows BTM if generation is non-exporting and ≥50% of demand is on-site. Generators majority-owned by the load customer's parent as of January 1, 2025 are exempt from co-location review.
Gas access: excellent. Permian, Eagle Ford, Haynesville. 40 GW of gas projects planned to power Texas data centers.
Permitting: TCEQ air permits run 3-6 months for minor source, 18-36 months for major source. Water is the emerging constraint, TCEQ now reviews any project >5 MW.
Tax: JETI program offers 100% school M&O abatement during construction, 50% in operations, sunsetting 2033.
Community climate: state-supportive but local opposition rising. Public polling shows 80% support for taxing AI data center electricity.
PJM (Ohio and Pennsylvania)
Speed to power: historically 4-8 years; reformed rules promise 1-2 years for projects entering Cycle 1 in spring 2026. Backlog of 195 GW still working through.
Capacity market: RPM auction provides predictable revenue. The 2026/27 and 2027/28 auctions cleared at the price cap ($329 and $333 per MW-day). This is a real second revenue stream for new gas, significantly improves financing.
Co-location rules: FERC's December 2025 order directed PJM to reform its tariff for co-located generation by January 2026, with partial acceptance in April 2026. The framework is still settling.
Gas access: Marcellus and Utica. TC Energy's Ohio open season covers 1.2+ Bcf/d. Pipeline expansion timelines run 2-4 years.
Permitting (Ohio): Ohio EPA + OPSB expedited "letter of notification" path. Meta Apollo (350 MW Wood County) compressed to ~18 months. No state property tax on equipment.
Permitting (Pennsylvania): PA DEP, similar timelines to Ohio. But 68% of PA voters oppose data centers in their neighborhood. Montour County rejected co-location rezoning in 2025.
Tax (Ohio): sales tax exemption with $100M investment threshold, no personal property tax.
Tax (PA): sales exemption exists but is under repeal threat by the Shapiro administration.
Community climate: Ohio is pro-business and supportive. PA is the most politically difficult market in the US for new gas-fired hyperscale.
Bottom line
ERCOT wins on speed to power. PJM Ohio wins on financing certainty (capacity market) and tax. PA carries the most political risk. The 1 GW reference project in ERCOT is fastest but trades capacity revenue for energy-only volatility. Same project in PJM Ohio takes longer but finances more cleanly. The right choice depends on which is the binding constraint, speed or capital cost.
More than $300B was committed across hyperscale DC + dedicated power deals in the 12 months from May 2025 to May 2026. Three patterns dominate.
Pattern 1: Behind-the-meter for speed
Oracle Shackelford runs 700 MW pure off-grid via 210 modular generators on the VoltaGrid platform. xAI Colossus runs 1.2-2 GW behind-the-meter from 27+ gas turbines. Meta El Paso uses 366 MW of modular Caterpillar units. Project Baccara in Phoenix runs 700 MW off-grid for two 1M-square-foot data centers. These projects bypass the ERCOT or PJM queue entirely. First power 2027-2028. They sacrifice grid capacity revenue for time.
Pattern 2: Utility partnership for scale
Meta Richland Parish co-developed 2,200 MW of dedicated Entergy gas turbines ($3.2B utility + $10B+ Meta DC). Compass Datacenters Mississippi with Mississippi Power for a 500+ MW $10B campus. Full capacity-market integration but slower (2028-2029).
Pattern 3: Nuclear for decarbonization
Microsoft-Constellation 20-year 835 MW Three Mile Island restart, accelerated to 2027 with $1B DOE loan. Amazon-Talen $18B 1.9 GW Susquehanna, transitioning to "front-of-meter" spring 2026 after FERC scrutiny. Google-TVA-Kairos 50 MW SMR with load-limiting agreements.
Implications for the reference project
A 1 GW gas + 1 GW DC co-located build in ERCOT is the most replicable pattern. It combines Pattern 1 (modular gas BTM for fast Phase 1 to 2028) with combined cycle for full 1 GW by 2031, plus grid backstop in 2032.
A hyperscale data center is a large industrial building with raised floor or slab, mechanical infrastructure for cooling, IT equipment racks (servers, switches, GPUs), power distribution gear, fiber connectivity, and physical security. Build-to-suit for a hyperscaler runs 12-24 months from greenlight to operational if the site is de-risked, power secured, fiber lit, permits in hand. Capex for a 1 GW DC campus runs $4-7B depending on cooling architecture and IT spec.
Why it matters
The DC is the off-taker. The energy plant exists to serve it. If the DC can't come online when the hyperscaler needs it, the energy plant has no customer. The DC's clock and the energy plant's clock are not naturally aligned, that mismatch is the central problem of the integrated model (see Section 17).
Cooling drives everything
Current hyperscale practice for AI training is direct-to-chip liquid cooling, with PUE targets 1.10-1.12 and water usage targets <0.30 L/kWh (Microsoft). New builds are testing closed-loop immersion to eliminate water dependency, at higher cooling capex.
Interdependencies
DC site is shared with the energy plant. Power dependency drives the timeline. Fiber dependency is fatal if missing. IT equipment lead times (GPUs, switchgear, transformers) compete with every other hyperscale project. Lease execution is the binary gate that unlocks DC construction financing.
Risk
Continuous on schedule and IT equipment delivery. Binary on tenant lease execution. Cliff on tenant exit.
Underwriting impact
DC build-to-suit dev IRR 25-40% over 3-4 year hold, stepping down to 8-10% stabilized. The same hyperscaler IG credit drives both DC lease and energy PPA, sub-IG cuts leverage on both sides. The credit quality cascade across all three stakeholders (DC developer, hyperscaler, energy developer) is one of the central coordination points in the cross-stakeholder capital optimization framework (Deep Dive 30).
The full Digital Master document treats DC development as its own subject. This section is the overlay summary needed to make the Energy Master complete.
The structural mismatch between when the data center is ready to come online and when the gas-fired energy plant can deliver firm full power. In the reference project, the DC could be physically built by 2027 (12-18 months from go), but the gas plant doesn't hit full 1 GW until 2031. The gap is roughly 3 years.
Why it matters
Hyperscalers do not sign 15-20 year leases without firm power on a date they can plan around. Energy developers do not commit dev capital without a signed PPA. The two parties stand on opposite sides of a chicken-and-egg problem. Without a coordination mechanism, no project happens.
Three approaches, what each actually does, what each doesn't
None of these three fully closes the gap. Read them as contrasts to the reference example, not as solutions.
Phased ramp with modular gas. Modular reciprocating engines (Wärtsilä, Caterpillar, INNIO) deliver 250-500 MW in months from NTP. H-class combined cycle arrives 5-7 years later for full 1 GW. The DC ramps load as power becomes available. Examples: Oracle Shackelford, Meta El Paso, xAI Memphis. This is the dominant near-term strategy for compressing the physical timeline to compute (alternatives in Deep Dive 22). It buys 18-24 months on first MW. It does not eliminate the wait for full power.
Hyperscaler vertical integration. The hyperscaler buys or co-develops the power source. Google's ~$4.75B acquisition of Intersect Power's digital power assets (reported December 2025; verify exact terms before any external use) is the canonical example. This does not compress the build timeline. Owning the power developer doesn't make air permits issue faster, doesn't shorten turbine lead times, doesn't build pipelines quicker. What it does: removes the chicken-and-egg counterparty problem, captures all power margin internally, provides delivery certainty. The hyperscaler still waits 4-5 years for full power.
Utility partnership. Regulated utility builds the plant under its own ratebase, hyperscaler is anchor customer. Meta Richland Parish with Entergy ($3.2B utility capex, $10B+ Meta DC). Also does not compress the build. What it does: provides regulated-utility credit (improves project financing), captures capacity market revenue (in PJM), and shifts development risk onto the utility ratebase. Slower to first power than phased modular gas. Better long-term economics than greenfield project finance.
The honest synthesis. Only phased modular gas actually moves the physical timeline. The other two strategies are valuable for different reasons, coordination, financing, risk shift, but they don't shorten the wait. The 3-year gap is structural. It comes from permits, pipelines, turbines, and EPC labor. Ownership structure and counterparty arrangement don't change the physics.
Interdependencies
The bridge chosen determines PPA timing, lease timing, capital sequencing, and risk allocation. Phased ramp keeps the energy developer at maximum risk. Vertical integration shifts risk to the hyperscaler. Utility partnership shifts risk to ratepayers.
Risk
Mixed. Binary on whether the gap is closed before either party walks. Continuous on cost of bridging. Cliff on tenant ramp delay if the bridge is fragile.
Underwriting impact
The gap creates a refinancing cliff if the bridge is not term-matched. Lenders model the ramp explicitly, a phased ramp project must show committed off-take volume escalation matched to plant phasing, with take-or-pay floors to protect against DC ramp delays.
Phased ramp is the only approach that actually compresses physical time. Section 18 (BTM Acceleration) is the deep dive on what that looks like in practice.
18, BTM Acceleration · The Path Everyone Is Taking
What it is
Behind-the-meter (BTM) modular gas. Reciprocating engines from Wärtsilä, Caterpillar, INNIO, deployed via integrator platforms (VoltaGrid QPac, TECO Westinghouse, Halliburton/INNIO partnership, Caterpillar Energy Solutions). Engines are 1-20 MW per unit. Practical minor-source ceiling is around 500-700 MW per site, limited by air permit aggregation rules (<100 tons/yr criteria pollutant), which depend on engine technology (modern SCR + ox cat units have ~0.1-0.3 g/bhp-hr NOx vs ~0.5+ for older platforms), operational hour caps, and state regulator interpretation (TCEQ more permissive than Ohio EPA than PA DEP). Above 500-700 MW, BTM still works, projects accept PSD major source review, which adds 18-24+ months to the permit timeline but unlocks larger scale. Halliburton/INNIO's 2.3 GW manufacturing deal signals that >1 GW BTM is coming for projects willing to do PSD. Reference deployments: Oracle Shackelford (210 VoltaGrid generators, 700 MW, at the upper end of minor source), Meta El Paso (366 MW modular Caterpillar), xAI Memphis (27+ turbines), Project Baccara (700 MW). Run on natural gas at 35-42% thermal efficiency (simple-cycle equivalent). Fast ramp (0-100% in 7-10 seconds for Caterpillar).
Why it matters
This is the dominant near-term strategy that compresses physical time to first power. Traditional CCGT takes 4-7 years. BTM delivers 250-500 MW in 12-24 months from project go. Other accelerators exist (nuclear restart, SMRs, grid headroom arbitrage), but BTM is the most scalable per-site near-term play. See Deep Dive 22 for the alternatives sensitivity table. That is the answer to the 3-year disjointedness gap. Every major hyperscale project shipped in the last 18 months has used some form of BTM modular gas, either as a permanent solution (xAI, Project Baccara) or as Phase 1 bridge to CCGT (the dominant pattern, used by the reference project).
Realistic timeline, even temp power is long
Aggressive 12 months. Typical 18-24 months. Modular OEM lead times in 2026 are 9-18 months (Halliburton's 2.3 GW deal with INNIO is expanding manufacturing capacity through 2028). Minor source NSR air permits run 6-12 months when structured below aggregation thresholds. Site prep, gas tap, electrical interconnection, commissioning add 3-6 months.
Capital outlay compression
Directional shape only. Same hyperscaler off-take. BTM has lower upfront capital and faster cash conversion. Trade-off is lifetime efficiency.
Traditional CCGT (1 GW): $125M dev capital + $500M-$1.5B turbine deposits committed in Y0-Y2, $2-2.5B construction draws Y2-Y6, total $2.5-3B before any revenue. First revenue Y5-Y7.
BTM Only (500 MW, minor-source typical): $20-50M dev capital + $700M-$1.2B equipment + EPC committed in Y0-Y1.5. First revenue Y1-Y2.
BTM Only (1 GW, PSD major source): ~$1.4-2.4B equipment + EPC, deployable in 30-48 months (12-24 mo build + 18-24 mo extra for PSD permit). Same per-kW economics, larger scale, longer permit.
Per kW first power: Traditional ~$2,500-3,000/kW for ~5 year wait. BTM ~$1,400-2,400/kW for ~1.5 year wait.
The backstop reality
No energy developer funds BTM without a backstop from the DC developer or hyperscaler. This is a project finance hard requirement. Four reasons: stranded asset risk (BTM has 10-15 year useful life; relocation costs $200-400/kW; secondary market is thin), limited useful life economics (35-42% thermal efficiency vs 50-64% for CCGT means 25-40% higher fuel cost per MWh), performance risk (90-93% availability vs 95-97% for CCGT), single-tenant exposure (no merchant tail).
Backstop structures actually used: hyperscaler balance-sheet capex (Google-Intersect model extended), interim PPA at premium price ($70-110/MWh vs $50-70/MWh for CCGT), take-or-pay covering 90%+ of capacity, letters of credit equal to 18-24 months of fixed payments, equipment lease structures (Halliburton/VoltaGrid 2.3 GW deal, Halliburton retains ownership, hyperscaler pays fixed lease rate), OEM manufacturer guarantee. Without one of these, no project finance lender will fund BTM development capital.
These backstop structures are functionally cross-stakeholder capital optimization in practice: each moves a specific risk to the party with the lowest cost of bearing it (usually the hyperscaler, which has lower cost of capital and direct control over offtake certainty) in exchange for hyperscaler upside on power-margin economics. Deep Dive 30 formalizes the framework that explains why these structures emerge in market.
Risk profile differs significantly from traditional
Risk dimension
Traditional CCGT
BTM Only
Hybrid
Air permit
PSD major (18-60+ mo)
Minor NSR (6-12 mo, aggregation risk)
Both
Equipment lead time
5-7 years
9-18 months
Both
Up-front capital at risk
$500M-$1.5B in deposits
$250-500M in equipment
$750M-$2B layered
Stranded asset risk
Low
High (limited life)
Medium
Performance availability
95-97%
90-93%
Mixed
Off-taker backstop
PPA standard
Interim PPA + backstop required
Both
Useful life
25-30 years
10-15 years (5-7 if bridging)
Mixed
Underwriting differs for both sides
Energy: PPA tenor 7-10 years vs 15-20, sponsor equity 40-50% vs 30-40%, debt premium 200-300 bps, DSCR 1.40-1.50x vs 1.30-1.40x, unlevered IRR 12-15% vs 8-12%. Often equipment-financed via OEM (60-70% of equipment capex via lease) or hyperscaler-funded via balance sheet (eliminates project finance entirely).
DC: Development IRR target unchanged at 25-40% but compute-online date moves up 3 years; same hyperscaler IG credit drives both sides; lease tenor may shrink to match BTM if no CCGT phase planned.
Hybrid is the dominant new-build pattern
BTM Phase 1 delivers first MW in 12-24 months. CCGT Phase 2 delivers full 1 GW by year 6-7. BTM gear retired or relocated as CCGT comes online. Reference project uses this. Combines speed (BTM) with long-term efficiency and credit (CCGT). Capital stack is layered, BTM financed separately (often as bridge facility or balance sheet), CCGT as long-term project finance. BTM's interim cash flows partially offset CCGT dev capital exposure.
Limitations
Practical minor-source ceiling 500-700 MW per site (above this, projects accept PSD major source review, adds 18-24+ months to permitting but no hard cap on scale). Higher fuel burn per MWh. OEM supply chain constrained. Stranded asset economics on relocation. Black start dependency (no grid fallback). Local pushback risk (xAI Memphis ran 35 unpermitted gas turbines, faced NAACP litigation).
What this means for the macro gap
BTM compresses one project's time to first compute. It does not solve the macro supply ceiling. Pipeline capacity (3-4 Bcf/d announced expansion through 2028), modular OEM capacity, air permit aggregation, and stranded asset economics still cap how much BTM the market can absorb. BTM is essential for individual projects. It is not a solution for the industry.
See also: standalone BTM_Analysis document for further detail on backstop structures, OEM landscape, and underwriting comparisons.
19, Illustrative Cash Flows
What it is
Two directional cash flow shapes, DC and energy plant, over the project life. Not a financial model, just the shape that reveals the alignment problem.
Data center
Year 0-1: dev capital $50-80M. Year 1-3: construction $3-5B. Year 3: COD, lease begins, revenue ~$300-500M/year. Year 4+: stabilized, 3% annual escalators, 15-year lease tail.
Energy plant
Year 0-2: dev capital $125M plus turbine deposits $500M-$1.5B. Year 2-6: phased construction $2-2.5B drawn over 4-5 years. Year 4: Phase 1 first power 250 MW, partial revenue $80-100M/year. Year 6: full COD, full revenue $300-400M/year. Year 8+: stabilized, 15-20 year PPA.
The shape difference matters
The DC trough is deep but short, 2-3 years of negative, sharp inflection at COD.
The energy plant trough is deeper and longer, 4-6 years of negative, partial revenue starts mid-trough, full revenue much later.
The DC reaches stabilization in 3-4 years (developer hold-to-flip; long-term hold cash payback at 9-11% YoC is 9-11 years). The plant reaches stabilization in 6-8 years.
Equity returns compress on the energy side (8-12% unlevered) vs the DC side (8-10% stabilized but 25-40% during dev).
Why it matters
Different cash flow shapes force different financing structures. DC financing uses construction-to-perm rollover at COD. Energy financing uses staged construction debt with mini-perm conversion at full COD. The two cannot share a single capital stack without complicated tranching. The fundamental mismatch drives the need for either integrated platforms (one party bears both shapes) or carefully structured cross-stakeholder coordination where each party's capital is matched to the risk profile it can most efficiently bear. Deep Dive 30 covers the coordination frameworks.
Risk
Continuous on capital deployment timing.
Underwriting impact
Lenders look at peak negative cash and time to stabilization separately for each side. The energy plant's longer trough and later payback put more pressure on off-taker credit and PPA tenor than the DC's lease does.
20, Case Studies
Three deals from the last 18 months
Case 1: Google's $4.75B acquisition of Intersect Power's digital power assets (Dec 2025)
Google partnered with Intersect Power and TPG Rise Climate in December 2024 to co-locate clean energy generation with data center capacity. Intersect raised $800M+ in that round. Exactly one year later, Google bought Intersect's digital power platform for $4.75B plus debt assumption. TPG launched IPX Power as an independent producer with the rest. Pattern: hyperscaler buys the power source, not just capacity. $5.55B committed in 12 months says traditional utility supply is not reliable enough or fast enough at scale. By owning generation, Google captures 100% of the power margin and avoids tariff exposure. This is the strongest signal yet that hyperscalers are now power developers.
Case 2: Nvidia's investments in Lambda Labs and CoreWeave (Feb 2025-Jan 2026)
Nvidia participated in Lambda's $480M Series D (Feb 2025, Lambda valued ~$4B) and signed a separate $1.5B GPU lease with Lambda (4-year term, 18,000 H- and B-series GPUs). Nvidia then invested $2B in CoreWeave equity (Jan 2026, building on $100M from 2023) and committed to purchase up to $6.3B in excess CoreWeave compute through April 2032. Total Nvidia commitments to compute platforms in ~12 months: $3.5B+. Pattern: chip vendor finances the data center / compute layer to ensure end-customer demand for the chips. Vertical integration without ownership, Nvidia takes equity and signs long-term capacity agreements but lets Lambda and CoreWeave operate independently.
Case 3: The utility-only DC model collapsing, Loudoun County, Virginia (2023-2025)
From ~2000 to 2023, hyperscale DC operators in Northern Virginia plugged into Dominion Energy under standard utility tariffs. No on-site generation, no PPAs, just utility service. The PJM grid had headroom and Dominion handled supply. In 2023-2025 the model broke. The PJM interconnection queue ballooned to 220 GW (2025), Dominion paused new large-load interconnections through January 2026, and Loudoun County ended by-right data center approvals in March 2025. NextEra's proposed 500 kV line from West Virginia through western Loudoun is in environmental review with a 5-7 year timeline. Pattern: the original DC model is dead. The market has bifurcated into utility-served projects (slow but capacity-paying) and behind-the-meter projects (fast but capital-intensive). A hyperscale site without secured power is now economically worthless.
What the three cases tell us together
The market is responding to the supply gap from three directions at once. Hyperscalers integrate up into power. Chip vendors integrate down into compute infrastructure. The traditional utility model is breaking and new models are taking its place. None of these is theoretical; all three are happening at $1B+ scale in the current 12-month window.
The structural ceiling on how much AI compute the United States can actually support given physical infrastructure, pipelines, transmission, permits, turbine OEMs, EPC labor, not silicon.
Validated supply numbers
US natural gas production in 2025: ~118 Bcf/d. Three top basins ~79 Bcf/d (Marcellus/Utica 36.6 Bcf/d, Permian 27.7 Bcf/d, Haynesville 14.9 Bcf/d). Gas-fired supply headroom for new DC load through 2030 is bounded across three views (full sensitivity in Deep Dive 22): **announced floor of 3-4 Bcf/d / ~19-25 GW** (Mountain Valley Pipeline Boost, Greene Interconnect, Boardwalk/Gulf South in current FERC filings , high confidence); **realistic estimate 5-8 Bcf/d / ~32-50 GW** (adds intra-basin gathering and processing, midstream M&A, LNG redirect, pre-FERC announced , moderate confidence, working assumption); **theoretical 10+ Bcf/d / ~63+ GW** if active policy intervention (Section 202(c), FERC fast-track, Trump emergency action , low confidence, not currently in market). At modern CCGT efficiency (~7,000 BTU/kWh, ~49% LHV), 1 Bcf/d ≈ 6.3 GW continuous output. The aspirational ceiling at 10 Bcf/d expansion is ~63 GW; that level of pipeline build is not currently announced.
Demand numbers
US data center electricity in 2025 was ~3.5% of total US generation, equivalent to 30-62 GW depending on operational vs peak. By 2030, consensus forecasts converge on 70-100 GW (McKinsey 606 TWh/yr ≈ 69 GW average; Goldman Sachs 70-80 GW; S&P Global 70-80 GW; EPRI 4.6-9.1% of total US electricity). Aggressive scenarios reach 100+ GW.
The crossing already happened, early strains binding now, deepest shortfall 2027-2028
Demand exceeded visible incremental supply in 2024-2025. The signs of binding now:
ERCOT's large-load queue: 252 GW, 77% data centers, 4-5 year processing timelines.
Dominion Energy paused new large-load interconnections through January 2026.
PJM closed new interconnection requests for nearly four years (2022-2025) to clear backlog.
Loudoun County ended by-right DC approvals March 2025.
There is no future date when supply will catch up. New pipeline takes 5-7 years. New transmission takes 5-10 years. New gas turbine orders deliver in 5-7 years. Even decisive policy action today does not move first power before 2030-2032.
Chip efficiency cannot save you
Nvidia's GPU progression V100 → A100 → H100 → H200 → B200 (2017-2025) delivered ~9× perf-per-watt over 8 years. Extrapolating to 2030 yields another 2-4×. Adding low-precision training (FP8 standard, FP4 emerging) can compress demand a further 1.5-2×. Realistic total: 3-8× by 2030.
Scenario
Plausibility by 2030
Effect on demand vs supply gap
50% improvement
Very likely
Demand grows faster, gap widens
100% (2×)
Likely
Gap remains 30-60 GW
200% (3×)
Aggressive base case
Gap narrows but persists
500% (5×)
Stretch goal
Gap closes only at conservative demand
1000% (10×)
Implausible by 2030
Would require photonics/paradigm shift at scale
10,000% (100×)
Not real in this timeframe
Discard from analysis
Demand grows ~20-25% per year. Efficiency grows ~30-40% per year on AI workloads. They roughly cancel. The structural gap is caused by physical infrastructure, not silicon.
When does gas become *the* limiting factor?
It already is in PJM and ERCOT. Behind that:
Pipeline build-out: 5-7 year horizon, FERC + easements
Air permits: 18-60 months, community opposition
Turbine OEM allocation: 5-7 year lead times, sold out at GE Vernova / Siemens / Mitsubishi through 2028-2030
EPC capacity: oversubscribed; 12-18 month delays just to lock contractor
Craft labor: 350-500K worker shortfall
What happens next
Bifurcation accelerates. Utility-served sites become slower and more valuable (capacity-paying premium 10-20%). Behind-the-meter pivots dominate fast deployments.
Hyperscaler vertical integration. Google-Intersect at $4.75B is the template. Expect more $1B+ acquisitions of clean-energy and gas developers by Microsoft, Meta, AWS over 2026-2027.
Real fixes require either (a) 20+ Bcf/d in new pipeline capacity over 5-10 years, (b) massive build-out of behind-the-meter renewable + storage at $1T+ scale, or (c) restoration of nuclear baseload (existing restarts plus SMRs at scale by 2030+). All three are happening in some form. None of them moves the needle before 2028.
22 , Assumptions, Confidence Levels, and Sensitivities
This section makes the doc's reasoning transparent. Every major claim is sourced to an assumption, with a confidence level and what changes if the assumption is wrong. Use this section to stress-test the doc and to understand which conclusions are robust versus fragile.
Confidence levels used in this guide
High: ≥80% confidence. Backed by primary sources (EIA, FERC, ERCOT filings) or near-universal industry consensus.
Moderate: 50-80% confidence. Consensus exists but uncertainty is material; reasonable people disagree on the central estimate.
Low: 30-50% confidence. Thesis-driven, range wide, dependent on multiple uncertain inputs.
Unknown: Insufficient data; flagged as such.
Assumption 1: Gas supply expansion 5-8 Bcf/d through 2030 (working estimate)
Logic. Announced floor of 3-4 Bcf/d (Mountain Valley Boost, Greene Interconnect, Boardwalk/Gulf South) is what's in current FERC filings. The "realistic" 5-8 Bcf/d adds: intra-basin gathering and processing additions (compression, looping, midstream M&A , not always FERC-filed), pre-FERC announced projects, LNG-to-domestic redirect potential, and intra-state pipeline additions. Theoretical 10+ Bcf/d requires policy intervention (Section 202(c), FERC fast-track, Trump emergency action). Confidence: moderate on the realistic estimate, high on the announced floor, low on the theoretical ceiling.
Scenario
Bcf/d added
GW headroom @ 49% LHV CCGT
Pessimistic
3 (announced only)
~19
Floor
4
~25
Realistic low
5
~32
Realistic high
8
~50
Theoretical
10
~63
Aspirational
15
~95
What changes if wrong. If supply lands closer to 3 Bcf/d, the deficit deepens by ~15 GW and BTM becomes even more critical. If supply reaches 10+ Bcf/d via policy intervention, ~half the deficit closes and the traditional CCGT path becomes viable for more projects.
Assumption 2: 2030 demand 70-100 GW with realistic upside to 120+
Logic. Consensus from McKinsey (606 TWh/yr ≈ 69 GW average), Goldman Sachs, S&P Global. Forecasts have been revised UP every six months for the last three years. Could surprise high if another Stargate-class commitment lands; could surprise low if algorithm efficiency or AI capex normalization compresses growth. Confidence: moderate.
Scenario
2030 demand (GW)
Driver
Low
60
Algorithm efficiency cliff, AI bubble normalization
Base
80
Current consensus midpoint
High
100
Aggressive McKinsey scenario
Stretch
130+
Another Stargate-scale commit lands
What changes if wrong. Low scenario plus theoretical supply = ceiling not binding. High scenario plus realistic supply = severe shortage requiring rationing or geographic offshoring.
Assumption 3: Chip efficiency 3-8× by 2030 (and the algorithm efficiency caveat)
Logic. Nvidia GPU progression V100→A100→H100→H200→B200 has delivered ~9× perf-per-watt over 8 years. Extrapolating yields 2-4× to 2030. Adding low-precision training (FP8, FP4) plausibly compresses another 1.5-2×. Total: 3-8× hardware-driven efficiency. Confidence: moderate on hardware, lower on algorithm.
The doc's chip efficiency dismissal omits algorithm efficiency. Mixture-of-experts (MoE), sparsity, distillation, and reasoning-vs-training mix shifts have compressed compute-per-task by 10-100× on specific workloads in the last two years. If algorithmic efficiency continues at recent pace, demand-per-revenue compresses faster than hardware efficiency rises.
Scenario
Hardware × Algorithm 2030
Effect on demand
Low
2× hardware × 1.5× algorithm = 3×
Demand grows roughly as projected
Base
4× hardware × 3× algorithm = 12×
Demand growth slows materially
High
8× hardware × 10× algorithm = 80×
Demand could plateau or fall
What changes if wrong. The doc's "5× efficiency does not close the gap" claim is the base case. At the high end (algorithm + hardware compounding), the gap could substantially close without infrastructure intervention. Confidence on the doc's framing: moderate. The "efficiency cancels demand" claim is defensible but presents a single scenario as if inevitable.
Assumption 4: BTM is the dominant , not the only , accelerator
Logic. The doc previously called BTM "the only strategy that compresses physical time." That was overstated. Three other accelerators exist with their own constraints:
Alternative
Realistic timeline
Total addressable
Constraints
Nuclear restart (TMI, Palisades, Diablo Canyon)
18-30 months from decision
~5-8 GW US potential
Geographically limited to existing nuclear sites; political and regulatory friction; not a 2026-2028 solution at scale, more 2027-2029
SMRs at scale (Kairos, X-energy, TerraPower, NuScale)
24-36 months once first plants commercial
10-30 GW by 2030 if milestones hit
Not proven at scale yet; first commercial SMRs targeting 2027-2030; depends on first-of-a-kind execution
Geothermal (Fervo Energy, Eavor, AltaRock)
18-30 months for 15-30 MW pilots; longer for GW scale
1-5 GW by 2030 in resource-favorable basins
Geographically limited to specific resource zones (Nevada, Utah, parts of Texas); scale unproven; long permitting under federal land
Grid headroom arbitrage
18-30 months in select ISOs
<15 GW US; small TAM
Small TAM; MISO, SPP, parts of TVA have actual headroom; quickly absorbed
Transmission upgrades (new 500 kV lines, gen-tie additions)
5-10 years per project
Major potential but slow
NEPA, state siting, FERC, easements; nothing material before 2030
Renewables + 4-hour storage
12-18 months
Lots of MW, no firm 24×7 capability
Doesn't fit AI training load profile alone; needs gas, nuclear, or longer-duration storage backup; long-duration storage (8+ hours) not yet at scale
The honest 2026-2028 read. None of these alternatives meaningfully relieves the 2026-2028 crunch. Nuclear restart and SMRs add real GW post-2027 but the pipeline doesn't compound fast enough to offset 2026-2028 demand growth. Geothermal at GW scale is post-2030. Grid headroom arbitrage absorbs quickly. Transmission upgrades are a 2030+ play. For the next 24-36 months, BTM modular gas remains the dominant accelerator with no close substitute. The alternatives become more material 2028-2030 and dominant post-2030 if execution holds.
What changes if wrong. If nuclear restart accelerates (Trump backing TMI/Palisades) or SMRs deliver on time (Kairos-Google, X-energy), there are legitimate non-BTM acceleration paths post-2027. BTM remains the dominant near-term accelerator (12-24 month execution, scalable per-site).
Assumption 5: Gas as the macro constraint , actually a multi-variable physical infrastructure constraint
Logic. The doc frames gas as the binding macro constraint. Reality: at any given site, the most-binding constraint varies , gas at some, transmission at others, air permit at others, water in Permian, community opposition in PA. Gas is the most binding single variable, but it's a co-constraint with transmission, permits, OEM allocation, EPC labor, water, and politics.
Region
Basin / gas access
Most binding constraint
Notes
ERCOT West Texas / Permian
Permian , most abundant US basin (27.7 Bcf/d, growing fastest)
Water + community + transmission
Gas headroom highest in US, but water permits (TCEQ now reviews any project >5 MW) and produced-water disposal cap effective deployment. Pacifico GW Ranch (7.65 GW air permit) sits here , illustrative of scale potential and friction.
ERCOT South Texas / Eagle Ford
Eagle Ford (~4.5 Bcf/d, mature)
Transmission to load centers + gas access at scale
Gas access slightly tighter than Permian but pipeline infrastructure better positioned to load centers (Houston, San Antonio). Fewer water/community issues than Permian.
ERCOT East / Haynesville
Haynesville (14.9 Bcf/d, dry gas, high pressure)
Transmission + LNG export competition
Gas plentiful and well-positioned to power generation, but Haynesville molecules are also feeding LNG export terminals. LNG netbacks compete with domestic power demand.
PJM Ohio / Marcellus & Utica
Marcellus/Utica (36.6 Bcf/d, largest US basin)
Transmission + capacity market wait
Gas plentiful (TC Energy 1.2+ Bcf/d open season Ohio active). PJM queue is the binding wall , was 195 GW backlog, reformed cycle 1 entry spring 2026.
PJM Pennsylvania
Marcellus/Utica access
Community + politics + transmission
Gas access fine; political risk dominates. 68% of PA voters oppose data centers. Montour County rejected co-location 2025. Avoid unless local champion.
MISO
Multi-basin (Bakken, Marcellus, Anadarko)
Transmission + permits
Gas fine; transmission queue is binding. Some headroom in southern MISO.
SPP
Anadarko, Permian access
Some headroom + permits
Less saturated than ERCOT/PJM; rising hyperscale interest. Smaller TAM.
TVA / Southeast
Multi-basin via interstate access
Permits + transmission + conservative regulators
Gas fine; conservative regulatory environment. TVA-Google-Kairos 50 MW SMR is the headline play.
Western (CAISO, WECC)
Permian + Anadarko via interstate
Politics + permits + water
Gas accessible but California regulatory environment hostile to new gas. Mountain West more permissive but smaller TAM.
Headroom comment. The "gas headroom today with no competing claims" criterion points hardest at Permian (pure abundance) and Marcellus/Utica (deepest basin, best pipeline diversity). Within those, sub-region matters: Pecos County and Reeves County in Permian have the most gas; eastern Ohio along TC Energy mainlines has the cleanest Marcellus/Utica access for hyperscale projects. Sites with already-installed firm transport contracts are the scarce asset.
What changes if wrong. Site selection logic should account for which constraint binds at each candidate site, not assume gas is always the answer.
Assumption 6: CCGT 4-7 year build timeline
Logic. H-class turbines have 5-7 year OEM lead times. PSD major source permits add 18-60+ months. EPC labor is constrained. Confidence: high under current conditions.
What could compress this. DOE Section 202(c) emergency orders, FERC fast-tracks, pre-approved standardized plant designs, Trump-administration emergency declarations. Realistic compressed timeline: 3-4 years if all align. Confidence on compression: low , these levers exist but are not currently in active use.
Logic. "Already binding now" is high confidence: ERCOT 252 GW queue, Dominion moratorium, Loudoun shutdown all visible today. "Deepest 2027-2028" is a forecast , depends on demand peak timing and supply lag. Confidence: high on the now, low on the future peak timing.
Sensitivity. Peak deficit could land 2026 (demand surges further), 2028 (current base case), or 2030 (delayed by efficiency or normalization).
Assumption 8: Underwriting numbers , base case only, not stress-tested
Logic. Numbers cited (8-12% unlevered IRR for energy, 14-18% levered, 25-40% dev IRR for DC, 9-11% YoC for hold) are reasonable industry consensus. Confidence: moderate under current conditions.
Stress
Effect
Risk-free rate 4% → 6%
All return targets compress 100-200 bps; debt sizing tightens
Gas price spike 50% (not pass-through)
Energy IRR could drop 200-400 bps if not fully tolled
Off-taker downgrade to sub-IG
Energy debt premium 150-250 bps; equity raise 10 percentage points
Project size below 500 MW
Lose scale economies; per-MW capex up 10-20%
What changes if wrong. Static numbers in a static rate environment. Real underwriting requires sensitivity tables. Treat the doc's numbers as base case only.
Assumption 9: Reference project is one scenario, not the template
Logic. 1 GW + 1 GW, ERCOT, IG hyperscaler is the most replicable pattern in market 2026, but real projects vary on every dimension. Confidence: high for the specific scenario, but the scenario itself is one of many.
Scenario
Variant
Key implications
Smaller scale
250-500 MW BTM-only
No CCGT phase; shorter useful life, premium pricing
Assumption 10: Demand-side response is missing from the macro picture
Logic. The doc treats demand as inelastic. Hyperscalers actually have multiple response mechanisms:
Demand-side lever
Effect on US gas constraint
Geographic arbitrage (relocate to less-saturated ISO)
Compresses pressure on tight regions
Time-shift training (off-peak compute)
Allows lower firm capacity per GW IT
Throttle inference under load
Demand-side dispatchability
Offshoring (Middle East, India, Brazil)
Reduces US demand, shifts elsewhere
Algorithm efficiency (MoE, distillation)
Compresses compute-per-task
What changes if this is added. The "fixed demand vs fixed supply" frame becomes "elastic demand vs constrained supply." Forecast deficit could be smaller. Strategic implication: demand-side flexibility is a real operational asset, not just a stretch goal.
Assumption 11: Macro stress scenarios not fully modeled
The doc treats current conditions (gas prices stable, methane rules current, OEM allocation as announced, hyperscaler credit IG-stable) as fixed. Real macro stress scenarios that could shift the entire framing:
Energy IRR compresses 200-400 bps if not fully tolled. Hyperscalers absorb the cost (firm power premium widens to $90-130/MWh) but project debt sizing tightens. Frontier-site economics get materially worse.
Methane regulation tightening / air permit delays
Moderate. EPA methane rules have been moving toward stricter monitoring and reporting; aggregation interpretations could harden.
Adds 6-18 months to PSD timelines. Modular minor-source path gets harder. Pushes more projects into PSD major source, extending timelines and capex. Could compress the realistic 5-8 Bcf/d estimate toward 3-4.
Turbine OEM allocation shifts (one OEM stumbles)
Low-moderate. GE Vernova, Siemens, Mitsubishi all running at capacity. Any single-vendor stumble (quality issue, supply-chain shock) cascades.
12-24 months added to projects depending on that OEM. Modular reciprocating substitution helps but caps scale. Industry-wide schedules slip.
Hyperscaler credit deterioration if AI capex slows
Low currently, moderate if AI revenue normalization is sharp. Top hyperscalers are deeply IG, but their willingness to pay current premium prices depends on AI revenue continuing to fund $100B+ annual capex.
Off-take credit weakens, debt sizing on energy projects tightens, equity premium widens 100-200 bps, some marginal projects don't finance. Most damaging at frontier sites with thin residual value cushions.
All four compound (downside scenario)
Low , but a real tail risk
The doc's base-case "BTM is the dominant accelerator" framing still holds, but project-level economics deteriorate materially. Hyperscaler vertical integration accelerates. The largest infra capital pools dominate; smaller developers get squeezed out.
What changes if these scenarios land. The base case holds, but underwriting cushions need to be deeper. Specifically: target IRRs should price the volatility (add 100-200 bps to required returns on frontier sites); off-take structures should include gas-price escalators and credit-deterioration triggers; site selection should weight basin proximity more heavily than the current framing implies.
The doc holds up well at the aggregate-thesis level (gas-constrained, 3-year disjointedness gap, BTM dominant accelerator, residual-value tension at frontier sites). It is most exposed at the granular forecast level (peak timing, supply add, demand growth, efficiency trajectory). Use the sensitivity tables above to stress-test conclusions.
23 , Interconnections (Generation and Large Load)
What it is
Every 1 GW gas plant has to interconnect to the grid, and every 1 GW hyperscale data center has to receive power from somewhere. Two parallel interconnection processes run for a co-located project: generator interconnection on the plant side, and large-load interconnection on the DC side. Both are multi-year ISO processes with deposit requirements and study cycles. Both are gating events for project finance.
Generator interconnection (FERC / ISO)
Standard three-stage study cycle: feasibility study, system impact study, facilities study, then interconnection agreement. ERCOT reformed under SB 6 and the Batch Study Process; median time in queue 4.1 years for new generation, 2.5 years from interconnection agreement to operation. PJM closed new interconnection requests 2022-2025 to clear backlog; reformed Cycle 1 entry opened spring 2026. MISO, SPP, CAISO each at varying degrees of queue reform. Study deposits typically $250K-$2M depending on project size and ISO; network upgrade cost obligations can run $50M-$500M+ for a 1 GW plant depending on local transmission capacity. Withdrawal penalties matter: if a senior queue project drops out late in the cycle, downstream projects can be re-priced as their network upgrade obligations shift.
Large-load interconnection
The data center's grid tie is its own ISO process, separate from the generator interconnection on the plant side. ERCOT large-load process formalized late 2024; queue reached ~252 GW by early 2026 with 4-5 year processing timelines and 77% of requests from data centers. PJM Co-located Load Transmission Service Agreement (CLTSA) requires its own study cycle. ISO-NE and MISO have analogous processes. Dominion Energy paused new large-load interconnections through January 2026. Cost includes study deposits, facilities deposits, and $/MW transmission charges; specific tariffs vary by ISO. Timeline: 4-5 years current ERCOT processing; 2-3 years in less-saturated ISOs.
Interaction on a co-located project
Three patterns:
BTM-only (Phase 1 only): Gas plant runs islanded; DC receives all power from the plant; no immediate generator or load interconnection needed. Bypasses both queues but creates a future obligation. Terminal value compressed.
Hybrid (BTM Phase 1, grid-tied Phase 2): BTM bridges first 12-24 months; both generator and large-load interconnection applications are submitted in parallel for the Phase 2 cutover. By the time first CCGT power lands, interconnection agreements should be executed. Reference project uses this pattern.
Fully grid-tied (no BTM): Both interconnections gate first power. Project timeline extended by the ISO study cycle (4-5 years in tight ISOs), which compounds with the gas plant build time.
Interdependencies
Generator interconnection studies depend on transmission topology, which depends on prior queue project decisions. A large project upstream that withdraws can reprice your network upgrade obligation. Large-load interconnection depends on local distribution capacity, transformer adequacy, and substation upgrades. Both depend on ISO modeling assumptions about other queue projects. The two processes share dependencies on local transmission planning at the regional planning level (CRR/CRP studies, RPM in PJM).
Risk
Binary on the interconnection agreement (no IA = no project for grid-tied; manageable but constrained for BTM). Continuous on the network upgrade cost (can escalate 2-3× during study cycle if senior queue projects withdraw). Cliff on withdrawal of senior queue projects (downstream projects reprice). For the load side, additional binary risk if the ISO study identifies inadequate local distribution capacity, requiring substation builds the DC sponsor may not have anticipated.
Underwriting impact
Lenders will not size construction debt without executed generator interconnection agreements (or, in BTM cases, without firm BTM offtake terms). Large-load interconnection deposits and facilities charges are part of the DC capital stack, not the energy capital stack, but both sides have to clear before either side closes financing. Project-on-project risk: if the load interconnection slips, the DC commit slips, which weakens the energy plant's off-taker credit, which compresses the energy debt size. See Deep Dive 11 on conditions precedent and project-on-project risk.
For the reference project (1 GW + 1 GW ERCOT BTM Phase 1, grid Phase 2 by 2032)
Generator interconnection submitted at NTP; expected agreement by year 3; network upgrade $100-300M depending on local transmission. Large-load interconnection submitted in parallel; expected agreement by year 3-4; facilities charges $50-150M. Total interconnection budget $150-450M, roughly 6-18% of total project capex. Critical detail: not all of this is gated until Phase 2 cutover; BTM Phase 1 operates with neither interconnection agreement in hand. The interconnection risk is back-loaded.
Every gas plant, every transmission expansion, and every data center substation needs a stack of high-voltage and medium-voltage electrical equipment: large power transformers (LPTs), substation transformers, switchgear, breakers, HV underground and overhead cable, UPS systems, and power conversion equipment. This stack is the most under-modeled supply chain in the AI-scale buildout, and on current evidence a more binding near-term constraint than gas in many corridors.
Why it matters
Industry data from DOE, EPRI, Wood Mackenzie, and OEM disclosures suggests:
Large power transformers (345-765 kV): Lead times have extended from 12-18 months historically to 24-36 months in 2026, with limited US manufacturing capacity. Major suppliers (Hitachi Energy, Siemens Energy, GE Vernova, ABB) are running at allocation; new US production capacity (Hitachi Energy in Hagerstown MD, Siemens in NC, GE in TN, ABB expansion) is ramping but lags demand. DOE's Large Power Transformer Initiative explicitly identifies this as a national security concern. Confidence: high; widely reported and confirmed by DOE filings.
Substation transformers (138 kV and lower): Lead times now 18-30 months versus historical 6-12 months. Reflects pull-forward of grid investment plus the AI/DC demand surge. Confidence: high.
HV switchgear and breakers (ABB, Siemens, GE Vernova): Tight global supply, allocation-driven. Lead times 18-24 months for AI-grade specifications. Confidence: high based on OEM disclosures.
HV underground cable: Limited US production. Domestic suppliers (Southwire, Prysmian US, Nexans US) ramping. Imports from EU/Asia subject to lead times and tariff exposure. Confidence: moderate.
UPS systems at hyperscale scale (ABB, Eaton, Vertiv, Schneider): Tight 2026-2027; specialized for AI cluster requirements. Confidence: moderate.
Diesel backup gensets (Caterpillar, Cummins, Kohler): 12-18 month lead times and growing. Critical for DC redundancy. Confidence: high.
Interdependencies
Transformer lead times gate substation construction, which gates plant energization. Switchgear and breakers gate substation completion. UPS gates DC commissioning. Backup gensets gate DC redundancy certification. Any one of these can delay first power by 12-18 months even if every other input is solved.
Risk
Continuous on lead time (can slip further if global demand stays strong). Binary on specific equipment specifications (custom-sized LPTs cannot be substituted). Cliff on geopolitical disruption to manufacturing or shipping (European supply, Asian components).
Underwriting impact
Sponsors increasingly need to place equipment orders 24-30 months ahead of NTP, holding manufacturer slots and deposits before financial close. Lenders are starting to require manufacturer LCs and slot confirmations as part of CP packages. Equipment cost can run 8-15% of total project capex on a 1 GW plant ($200-450M); deposits and slot fees represent 10-20% of that. The equipment supply chain is becoming a financing requirement in its own right, parallel to the turbine reservation discussion in Deep Dive 5.
Mitigation strategies in the market
Long-term supply agreements with specific OEMs (multi-project orders that lock allocation). US-domestic manufacturing partnerships (Hitachi Energy expansion in Maryland, Siemens in North Carolina, GE in Tennessee). Standardized DC substation designs that reduce custom equipment needs. Strategic equity in OEMs (rare but emerging). Sponsor balance sheet to carry equipment inventory across multiple projects.
A 1 GW gas plant and a 1 GW hyperscale data center together consume meaningful volumes of water for cooling, process makeup, and emissions control. Water is a regional constraint that can kill a project that has solved every other input. Water is the most under-modeled regional showstopper for projects in growth corridors (Permian, Phoenix, Atlanta, parts of MISO).
Why it matters
Cooling water (evaporative). A traditional hyperscale DC with evaporative cooling consumes 0.5-2 million gallons per day per 100 MW; a 1 GW campus runs 5-20 MGD. A gas plant with wet cooling adds another 5-15 MGD. Combined water demand can rival a small city.
Process water and chillers. Lower volume but high quality requirements. Liquid-cooled AI training clusters reduce evaporative demand but increase process water and chilled water loops.
Groundwater extraction permits. TCEQ in Texas reviews any project >5 MW for water impacts. Permian-region projects face explicit aquifer stress (Ogallala, Edwards). Arizona has similar limits in active management areas. Confidence: high.
Watershed limits and drought. Federal water rights (Colorado River, ACF basin) and state-level allocations create hard caps in dry regions. Confidence: high.
Regional dynamics
Permian (West Texas): Most binding. Active TCEQ review of all DC >5 MW. Aquifer stress on the Ogallala. Produced-water reuse emerging but capital-intensive. Pacifico GW Ranch (7.65 GW Pecos County) has had to engineer around water specifically.
Phoenix / Arizona: Tight via Active Management Area rules. Goodyear and Mesa have explicit DC water caps.
Atlanta: ACF basin disputes; Georgia has tightened DC water permitting.
Northern Virginia: Less constrained on volume but local watershed protections active.
PJM Ohio / Marcellus: Generally water-rich; less binding.
MISO and Midwest: Variable; specific aquifers under stress (Mahomet, Cambrian-Ordovician).
Interdependencies
Water permitting often gates air permitting (some PSD permits require coordinated water review). Cooling design (wet vs hybrid vs dry) drives turbine selection and plant footprint. Liquid cooling adoption on the DC side reduces evaporative load but increases process and chilled water demand. Site selection that ignores water can require multi-year permit fights that no other input can resolve.
Risk
Binary on water rights or permits (no water permit = no project). Continuous on cost (treatment, transportation, alternative supplies). Cliff on drought-driven curtailment in already-stressed basins.
Underwriting impact
Lenders increasingly require independent hydrogeology studies as part of due diligence. Water-rights documentation is a CP for financial close in stressed basins. Sites with secured water rights trade at a premium; sites with unsecured water are heavily discounted regardless of other attributes.
Mitigation strategies in market
Closed-loop / dry cooling. Reduces water consumption 80-95% but adds capex and reduces efficiency (heat rejection penalty). Microsoft has piloted zero-water DC cooling.
Brackish or produced water. Treatment cost $0.50-2.00/bbl; emerging at Permian-scale projects.
Recycled / reclaimed water from municipal sources. Used by some hyperscale sites in Phoenix and Atlanta.
Air-cooled gas turbines. Available but less efficient than wet-cooled CCGT.
Liquid cooling on the DC side. Direct-to-chip and immersion cooling reduce facility-level water but increase process water complexity.
Behind every gas plant, DC, transmission line, and substation sits a stack of physical commodities: copper, steel, aluminum, rare earths, concrete, and specialty alloys. At AI-buildout scale, several of these are tightening over 2027-2030, with multi-year lead times to expand supply.
Why it matters
Copper is the most often-cited mid-term crunch. Used in transformer windings, busbars, HV cables, motor windings, generator windings, and grounding systems. Global mine production is ~25 Mt/yr; new mines have 10+ year permitting and development cycles. Wood Mackenzie, BHP, Rio Tinto, and Freeport-McMoRan have published outlooks indicating structural deficit emerging 2027-2030 as electrification, AI infrastructure, and EV demand combine. Pricing in 2026 already reflects tightening. Confidence: high; widely modeled across primary research.
Steel (specialty grades for HV equipment, generator housings, pressure vessels). Commodity steel is generally adequate, but specialty grades for transformer cores, generator housings, and pressure vessels are tightening. Confidence: moderate.
Aluminum (HV cables, structural elements). Adequate near-term but energy-intensive to produce; supply risk if regional power costs escalate or trade restrictions tighten. Confidence: low-moderate.
Rare earth metals (neodymium, dysprosium, terbium for motors and magnets). China dominates 60-80% of mining and 85-90% of processing. Export-control risk is a structural concern for grid equipment that uses high-performance permanent magnets. US production at Mountain Pass (MP Materials) and processing capacity are scaling but lag demand. Confidence: high on geopolitical exposure; moderate on US substitution speed.
Concrete and aggregates. Not a global limit but regional logistics tight in growth corridors. Specialty concretes (high-strength, low-shrink for substation pads, turbine foundations) tight in some markets. Confidence: moderate-low.
Fiber optic cable and conduit. Generally adequate but tight for high-density AI cluster requirements. Confidence: moderate.
Interdependencies
Materials gate equipment, equipment gates plant construction, plant construction gates first power. Copper specifically feeds into transformers (DD24), generators (DD5), and DC busbar/wiring. Rare earths feed into specialty motors and the magnets used in some renewable generators (offshore wind in particular).
Risk
Continuous on copper (price escalation and lead-time tightening). Cliff on rare-earth export controls or trade disruption. Binary on critical specialty alloys for specific equipment.
Underwriting impact
Materials are typically embedded in EPC contract pricing, so the direct exposure is contractual (escalators, cost-plus provisions). Sponsors should request material-cost passthroughs in EPC contracts on long-cycle items, particularly copper and specialty steel. Insurance against material-cost overruns is limited.
Mitigation strategies
Long-term supply agreements with materials providers (rarely available at single-project scale). Domestic-content premiums in EPC contracts where IRA bonus credits apply. Equipment specifications that minimize copper or rare-earth content (lower-efficiency alternatives sometimes available). Strategic stockpiling at sponsor level (rare; capital-intensive).
Skilled trades and engineering labor required to build, commission, and operate gas plants, transmission infrastructure, substations, and hyperscale data centers. Labor is already binding and structurally hard to expand on the timeline AI demand requires.
Why it matters
Labor is the slowest of all constraints to expand. New tradespeople require 4-5 year apprenticeships (electricians, pipefitters, welders, linemen). New EPC engineers require 4-6 year university plus 5+ years of project experience. Even if every other constraint loosened tomorrow, labor would still bind.
The specific shortages
Licensed electricians. US has ~700K licensed electricians; BLS projects ~10K/yr net additions through 2032. Industry sources (NECA, IBEW, NABCEP) estimate a 350K-500K shortfall by 2030 driven by electrification, AI/DC, EV charging, and grid upgrades. Confidence: high on the directional shortfall; specific number varies by source.
Pipefitters and welders. Aging workforce; mean age in the trades has risen 8-10 years over the past decade. Replacement rate insufficient. Critical for gas plant construction. Confidence: high.
HV transmission linemen. Very small specialized pool (~150K nationally). Apprenticeship is 4 years post-electrician. Compounds the transmission buildout constraint covered in Deep Dive 21 and Deep Dive 23. Confidence: high.
Civil and structural engineers (DC + plant design). Major engineering firms are turning down work. Sargent & Lundy, Burns & McDonnell, Stanley Consultants, HDR all signaling oversubscription. Confidence: moderate-to-high.
Electrical engineers (power system design, SCADA, controls). Tight for AI-grade specifications. Confidence: moderate.
EPC firm capacity (Bechtel, Black & Veatch, Burns & McDonnell, Fluor, Kiewit, Day & Zimmermann, Sargent & Lundy). Oversubscribed across the major firms. 12-18 month wait just to lock a Tier 1 EPC contract. Confidence: high.
Data center commissioning engineers (AI training cluster experience). Small specialized pool given how new AI cluster operations are. Hyperscalers compete aggressively for this talent. Confidence: moderate.
Plant operators and DC technicians. Tight in remote regions where greenfield projects locate. Often requires significant relocation premium. Confidence: moderate.
Apprenticeship pipeline
US trade-school enrollment has been recovering from a multi-decade decline. IBEW, UA Plumbers & Pipefitters, IUOE (operators), and similar are expanding apprenticeship programs. IRA prevailing-wage and apprenticeship requirements (for bonus credits) are driving meaningful funding into pipelines. The Trump administration's policy direction on these requirements remains uncertain. Workforce additions from these programs lag demand by 4-5 years.
Geographic distribution
Labor pools concentrate in legacy industrial regions (Gulf Coast, Northeast, Upper Midwest). Hyperscale buildout in growth regions (West Texas, Phoenix, Mountain West, Carolinas) requires either relocation premium (30-50%+ wage uplift) or contractor mobilization from out-of-region. Per-diem and travel costs are now material line items in EPC budgets.
Interdependencies
Labor gates everything operational. No electricians = no substation completion. No pipefitters = no gas plant. No linemen = no transmission tie. No commissioning engineers = no DC startup. Labor compounds with equipment supply (DD24): even if transformers arrive, you need linemen to install them.
Risk
Continuous on wage inflation (15-25%+ YoY in tight markets for specialized trades). Binary on apprenticeship completion for licensed trades. Cliff on union strikes or regional labor disruption in growth corridors.
Underwriting impact
Labor costs are now 25-35% of total EPC budgets for hyperscale gas plant construction, up from 18-25% historically. EPC contracts increasingly include labor escalation clauses. Lenders are starting to require labor mobilization plans as part of CP packages. Insurance against labor disruption is limited and expensive.
Mitigation strategies in market
Multi-year EPC framework agreements that lock crew allocation across multiple projects.
Sponsor-funded training programs for specific trades (rare but emerging).
Modular construction that shifts work from site to factory (offshore module fabrication for some plant elements).
Vendor-installed equipment that reduces on-site labor demand.
Mobilization premiums and per-diem structures that attract crews to growth regions.
Robotics and automation in specific trades (welding, some electrical work) where standards permit.
Beyond the project finance basics covered in Deep Dive 11, the AI-scale buildout is testing several adjacent capital-market constraints: infrastructure equity dry powder, project finance debt at scale, insurance capacity, performance bonding, and sovereign capital deployment. These are supporting constraints that can become binding when other inputs (equipment, labor, permits) stack up against project economics.
Why it matters
Infrastructure equity dry powder is at record levels but allocated across many themes. Stonepeak, Brookfield, KKR Infrastructure, Macquarie Infrastructure Partners, Global Infrastructure Partners (BlackRock), I Squared, EQT Infrastructure, Antin, and similar firms collectively hold $300-500B in dry powder. AI/DC and power are major allocations but compete with transportation, social, and renewable infrastructure. Confidence: moderate.
Project finance debt at scale. Money-center banks (JPMorgan, Citi, BofA, Wells Fargo, MUFG, Mizuho, BNP, SocGen, Santander, Sumitomo) all active. Insurance company direct lending (TIAA, MetLife, Pacific Life, Voya, New York Life) increasingly active for long-tenor permanent debt. Confidence: high on activity; moderate on capacity headroom at scale.
Insurance capacity. Construction all-risk insurance for $2-5B projects requires syndication across Lloyd's, Marsh, Aon, Willis, multiple London and European markets. Delayed startup insurance is tight and expensive. Confidence: moderate.
Performance and surety bonding. EPC contracts of $1B+ require performance bonds typically 10-20% of contract value. Surety market capacity tight at the high end. Liberty Mutual, Travelers, Chubb, Zurich, AIG dominate; capacity beyond $300-500M per bond requires syndication. Confidence: moderate.
Letter of credit (LC) capacity from money-center banks. Required for turbine deposits, FT precedent agreements, EPC milestones, decommissioning reserves. Capacity generally available but priced up. Confidence: moderate.
Sovereign capital deployment. PIF (Saudi Arabia), MGX (Abu Dhabi), GIC (Singapore), Temasek, QIA, KIA, ADIA all positioning in AI infrastructure. Very large checks possible ($1-5B+ per investment) but governance and CFIUS overhead can slow deals. Confidence: moderate.
Pension fund consortia. CPP, OMERS, OTPP, USS, CalPERS, ABP, and other large pensions matching long-duration infrastructure mandates to AI/DC opportunities. Confidence: high on appetite; moderate on deployment speed.
Pre-revenue / dev-stage debt facilities
A relatively new structure in the AI/DC space: specialized infrastructure debt funds (some operated by Macquarie, Brookfield Credit, Generate Capital, Energy Capital Partners) willing to provide dev-capital facilities to sponsors with strong hyperscaler relationships. Typically 200-300 bps over construction debt benchmarks. Helps bridge the dev-stage capital gap covered in Deep Dive 11 / CPs subsection.
Interdependencies
Capital markets capacity is downstream of bankability inputs (CPs in Deep Dive 11). If equipment, labor, permits all clear, capital is generally available at price. If those bind, capital costs rise and may exceed project IRR thresholds. Insurance capacity is tied to specific perils (construction risk, COD risk, operational risk) and tight markets for any one peril can stall financing.
Risk
Mixed. Continuous on pricing (spreads widen if competing capital demand rises). Binary on regulatory shifts (Basel rules, sovereign CFIUS treatment). Cliff on credit-cycle shocks that simultaneously freeze multiple capital markets.
Underwriting impact
Sponsors increasingly structure capital stacks that pre-arrange multiple layers in parallel (equity, dev-stage facility, construction debt, permanent debt, insurance, bonding) rather than sequentially. Multi-tranche debt structures with refinancing options are common. Insurance LCs and surety bonds increasingly built into CP packages.
Mitigation strategies
Multi-bank syndication for $1B+ debt issues; reduces single-lender exposure.
Insurance laddering that combines construction all-risk, delayed startup, professional liability, and surety into integrated packages.
Sovereign anchor LP for large equity rounds; reduces fund-level capital strain.
Sponsor consortium with combined balance sheet that can hold pre-financial-close capital.
Pre-arranged refinancing with permanent debt providers committed at construction close.
29 , Cross-Constraint Compounding (The Weakest Link in a Long Chain)
What it is
A structural observation about how the constraints catalogued in Deep Dives 1-28 interact. No single constraint determines project outcomes alone. Multiple constraints bind simultaneously, and a single slip in any one cascades through the others. This is the "weakest link in a long chain" pattern: at any given moment, one input is binding hardest, but the chain has too many weak links for sponsors to manage them sequentially.
Why it matters
Traditional project finance assumes a primary constraint can be solved by deploying capital. The AI-scale buildout breaks that assumption because the primary constraint is rarely the same across two projects, and most constraints cannot be expanded with capital alone (labor takes 4-5 years to train; transformers take 24-36 months to manufacture; permits take 18-60 months to issue; pipelines take 5-10 years to build).
The interaction map
For a 1 GW gas + 1 GW DC project, each constraint compounds with others:
Constraint
Direct gating effect
Compounding effects
Firm gas transport
No FT = no project
EPC won't start; lenders won't close; some permits require FT
The structural pattern: linear dependencies, not redundancy
Most projects can compensate for a single constraint by paying more or waiting longer. AI-scale projects cannot. Five examples observed in market 2025-2026:
A site secures gas but loses 18 months on transformers. Project economics compressed; offtake counterparty exits.
A site solves labor by paying mobilization premium but exceeds water permit limit. Years of additional permitting; sponsor walks.
A site has all permits but the EPC firm cancels the contract. New EPC requires 12-18 months to onboard; turbine delivery slot may slip.
A site has financing but the hyperscaler delays offtake commit by 6 months. Equity gap opens; capital stack restructured.
A site has everything but the upstream queue project withdraws. Network upgrade obligation increases 2-3×; budget breached.
In each case, the constraint that bound was not the constraint the sponsor originally underwrote against.
Risk taxonomy through the compounding lens
Binary constraints (air permit, FT, interconnection agreement, water permit, offtake credit): one slip kills the project unless mitigated upfront.
Continuous constraints (transformer lead time, EPC pricing, labor wages, materials cost): manageable with capital and time, but cumulative across many constraints.
Cliff constraints (force majeure, upstream queue withdrawal, OEM default, hyperscaler MAC): low probability per constraint, but the probability of at least one cliff across 8-10 binding constraints is significant.
Underwriting impact
Single-constraint mitigation is insufficient. Sponsors increasingly need integrated mitigation across multiple constraints in parallel:
Capital stack designed for delays in any of 3-5 binding inputs, not just one.
CP sequencing that lets the project pass through milestones even if one CP slips.
Insurance and bonding integrated with operational mitigation (delayed startup insurance combined with mobilization premium budget).
Counterparty diversification where possible (multiple FT counterparties, multiple OEM relationships, dual-source insurance).
Project portfolio approach rather than single-deal: a sponsor running 4-5 deals can absorb one slip; a sponsor running one deal cannot.
The strategic observation
The pattern of consolidation in market 2025-2026 (hyperscalers acquiring developers, OEMs partnering with integrators, infra funds building hyperscaler relationships, sovereigns taking direct positions) is best explained as the market's response to compounding cross-constraint risk. No single firm can manage the chain alone; integrated platforms with diversified counterparty positions are the structural answer the market is converging on.
Mitigation strategies that work across multiple constraints
Site selection that solves multiple constraints upfront (firm gas + grid path + water + labor pool + community).
Long-term relationships with OEMs, EPCs, and counterparties that smooth allocation across cycles.
Sponsor balance sheet that can absorb dev-stage capital exposure across multiple deals.
Hyperscaler partnership that pre-commits to offtake regardless of which constraint binds.
Geographic diversification across multiple ISOs to spread regional risks.
30 , Bridging the Three Stakeholders (Cross-Stakeholder Capital Optimization)
What it is
Every hyperscale AI infrastructure project requires three parties to coordinate: the data center developer, the hyperscaler off-taker, and the energy infrastructure developer. Each brings different capital, different risk tolerance, different time horizon, and different cost of bearing specific risks. The capital-efficiency question, and in our analysis the central financing question of this market, is how to allocate each project risk to the party with the lowest cost of bearing it. This deep dive frames that as a multi-party optimization (a coordination problem with game-theory characteristics) and surveys the bridging structures that have emerged in market 2025-2026.
Why it matters
When risk lands on the wrong party, capital cost across the stack rises. The hyperscaler's near-zero cost of capital is wasted if it sits idle while a sponsor at 12% cost of equity carries a risk the hyperscaler could absorb for free. Conversely, putting operating risk on a hyperscaler that has no operating capability creates execution friction. The right allocation lowers blended cost of capital, accelerates timeline, and creates space for additional projects to clear that would not otherwise be financeable. Done well, all three parties capture more value than in bilateral or single-party structures.
The three parties and what each can efficiently bear
Building on the table in the Scope section, the per-risk allocation framework looks like this:
Risk
Lowest-cost bearer
Why
Compute timing (revenue gating for AI services)
Hyperscaler
They need it for their own business; near-zero cost of bearing this risk since they own the upside
Power delivery certainty (will gas/electrons arrive)
Energy developer
Specialized; bonded; PF debt sized to this risk
Site selection (six dimensions)
DC developer
Specialized; lowest cost of selecting and developing sites
Construction risk (DC)
DC developer + EPC
Specialized; mature insurance market
Construction risk (plant)
Energy developer + EPC
Specialized; PF construction debt + bonding
Permit risk
Energy developer + sponsor consortium
Specialized legal and regulatory teams; long-cycle
Equipment lead-time risk (transformers, turbines)
Energy developer + OEM
Specialized; can hold manufacturer slots
Interconnection risk (gen and load)
Energy and DC developers respectively
Specialized; ISO-facing
Fuel-price risk
Hyperscaler via tolling
Lowest cost of bearing; pass-through to AI service pricing
Long-term operating risk
Utility or infra fund
Long-duration capital matches asset life
Residual value risk (DC after lease 1)
Hyperscaler
Only credible re-leasing tenant at GW scale outside core hubs
Capacity market risk (PJM, MISO)
Energy developer with utility partnership
Specialized; participates in capacity auctions
Pre-PPA dev capital
Hyperscaler or sponsor consortium
Lowest cost; covered in detail in DD11
Counterparty MAC risk (one party walks)
Sponsor consortium with parent guarantees
Diversified across pipeline
This allocation framework is the underlying economic logic behind every bridging structure observed in market 2025-2026.
Common bridging structures, framed through the three-party lens
Traditional bilateral structure. Energy developer signs PPA with hyperscaler; DC developer separately leases to hyperscaler. Each bilateral. Each party bears the risks that fall naturally to them; coordination friction managed by counterparty negotiation. Works at smaller scale but breaks under hyperscale weight (the 3-year gap, multi-constraint reality covered in DD17, DD23, DD29).
Hyperscaler-funded dev capital (Google / Intersect $4.75B template). Hyperscaler pre-funds dev capital because their cost of bearing dev-stage risk is lower than the sponsor's. Energy developer keeps operating risk; DC developer keeps lease risk. Hyperscaler captures full power-margin economics. Coordination friction eliminated by hyperscaler owning the developer outright. Best fit: hyperscalers with deep balance sheets willing to internalize. Limit: only 5-6 hyperscalers operate at this scale.
OEM equipment lease (Halliburton / INNIO 2.3 GW template). OEM retains ownership of equipment because their cost of bearing equipment-residual risk is lowest (secondary market control). Sponsor pays fixed lease under hyperscaler take-or-pay backstop. Equipment risk shifts to OEM; sponsor bears construction and operations; hyperscaler bears offtake. Three parties optimized across three risks. Best fit: BTM equipment specifically; less developed for CCGT.
Utility partnership (Meta / Entergy Richland Parish template). Utility builds gas plant on ratebase because regulated utility credit lowers debt cost; capacity market revenue captured (in PJM-style markets); development risk shifts to utility ratepayers. DC developer keeps DC build; hyperscaler keeps offtake commit. Best fit: regulated markets where capacity payment economics support utility participation. Limit: slower to first power than BTM; tariff structures vary by state.
Tolling agreement structure. Hyperscaler pays a fixed tolling fee that includes both capacity payment and fuel pass-through. Energy developer is insulated from fuel-price risk (hyperscaler bears it); hyperscaler insulated from operating risk (developer bears it). Tolling becomes the financial expression of optimal risk allocation. Best fit: long-tenor (15-20 year) PPAs with IG counterparty. Variant: Halliburton/INNIO 2.3 GW deal extends similar logic to equipment.
Integrated platform (the consolidation pattern). Single sponsor consortium combines DC development, energy development, and hyperscaler offtake relationships under one umbrella, with diversified counterparty positions. By internalizing all three roles, the platform eliminates cross-party coordination friction entirely. Risk is allocated to the LP base with the lowest cost of bearing it (long-duration pension, infra mandate, sovereign capital). Best fit: large-scale platforms with capability stack to span three roles. Limit: requires unusual combination of operating capability + capital + relationships.
The capital-efficiency mathematics
A stylized example: a 1 GW project with $5B total capex. If the bilateral structure forces the energy sponsor to carry the dev-stage capital ($600M-$2B) at 15% cost of equity for 36 months, the carrying cost is ~$270-900M (NPV-adjusted). If the hyperscaler at ~4% cost of capital carries that exposure instead, the carrying cost drops to ~$72-240M. The ~$200-660M differential is value created by optimal risk allocation. That differential is what bridging structures monetize, either through tighter PPA pricing for the hyperscaler, higher IRR for the sponsor, or accelerated project economics for all parties.
Where coordination breaks down (and why)
Information asymmetry. Each party knows its own constraints but not the others'. The hyperscaler may not know how much the energy developer is paying to hold turbine reservations; the energy developer may not know how much the hyperscaler is willing to pre-pay; the DC developer may not know what offtake terms the hyperscaler will accept.
Different time clocks. DC build is 12-18 months; energy build is 4-7 years; PPA is 15-20 years; hyperscaler compute cycle is 3-5 years per generation. Each party plans on a different time scale. Coordination requires a shared roadmap that accommodates all three.
Different definitions of "risk." A risk that's binary for one party may be continuous for another. A 6-month permit slip is binary to the energy developer (CP not met, construction debt does not close) but continuous to the hyperscaler (their compute date shifts but their business continues).
Counterparty MAC clauses. Each party reserves the right to walk under specific conditions. If those conditions cascade across counterparties (one party invokes MAC, triggering MAC at the next, etc.), the project structure collapses. Pre-negotiating cross-MAC standstill provisions is increasingly common.
The role of insurance, bonding, and structured guarantees
Beyond party-level optimization, the market uses insurance products (construction all-risk, delayed startup, professional liability) and bonding (performance, surety, completion) to redistribute residual risks to specialized capital pools that have the lowest cost of bearing those specific perils. Lloyd's and London markets carry construction all-risk for $2-5B projects; surety markets bond EPC performance; OEM warranty programs cover equipment performance. Each of these is itself a stakeholder, with its own capital cost and risk tolerance, layered onto the three-party structure.
Underwriting impact
Lenders increasingly require evidence that risk allocation across the three parties is optimal before sizing debt. The pattern in market 2025-2026: pre-negotiated three-way agreements (sponsor + hyperscaler + utility or OEM) with explicit risk-bearer designation for each major project risk. Coordination is the underwriting standard, not bilateral counterparty quality alone.
For the reference project (1 GW gas + 1 GW DC, ERCOT, BTM Phase 1 to grid Phase 2)
Optimal allocation looks like: hyperscaler bears compute timing and fuel-price risk via take-or-pay tolling; energy developer bears construction, permitting, equipment lead-time, and operating risk; DC developer bears site selection, DC construction, and lease tenant credit risk; insurance markets bear specific perils (construction all-risk, delayed startup); surety markets bear EPC performance; OEMs bear equipment performance via warranty programs. Each party signs into its native risk envelope; cross-party MAC standstill provisions prevent cascading walks. The blended cost of capital across the stack lands meaningfully below what a bilateral structure would produce.
Four conclusions plus synthesis. If you read only the Bottom Line and this section, you have the core thesis.
Four conclusions. Read these if you read nothing else.
1. The 3-year structural gap is unavoidable with current near-term technology, and BTM modular gas is the dominant bridge through 2028.
Data centers can spin up in 12-18 months while firm gas-fired power cannot. Air permits (18-60+ months), H-class turbine lead times (5-7 years, sold out at the OEMs through 2030), gas pipeline laterals (18-36 months for firm transport), large power transformers (24-36 month lead times), craft labor (350,000-500,000 worker shortfall per NECA/IBEW), and EPC oversubscription combine to create a built-in 4-7 year lag. Among the near-term strategies running in market (phased modular gas, hyperscaler vertical integration, utility partnership), industry deployment patterns suggest phased modular gas is the dominant accelerator through 2028. The other two shift risk or financing without compressing the build. Beyond the near-term, nuclear restarts are anticipated: (5-8 GW potential by 2030 with grid interconnection risk), SMR deployment (10-30 GW potential subject to lead-program milestones), and renewables-plus-storage at firm-power scale (8-12+ hour duration storage) play larger roles. The current hyperscaler shift toward nuclear partnerships (Microsoft-Constellation, Amazon-Talen, Google-Kairos) reflects the same physical-infrastructure reality from a different time horizon.
2. The macro ceiling is multi-constraint, not single-input. Gas, transmission, transformers, labor, water, and permits all bind simultaneously through 2030.
A 1 GW combined-cycle plant burns ~150 MMcf of gas per day. US gas-fired supply headroom through 2030 sits in three views: announced floor 3-4 Bcf/d (~19-25 GW, high confidence), realistic estimate 5-8 Bcf/d (~32-50 GW, moderate confidence, our working assumption), and theoretical 10+ Bcf/d (~63+ GW, low confidence, requires policy intervention). Consensus 2030 demand is 70-100+ GW. But gas is not the only constraint binding through 2030. Industry data on transformers (24-36 month lead times, DOE-flagged supply concern), labor (350-500K electrician shortfall per BLS/NECA), water (TCEQ reviewing every Texas DC >5 MW, AMA caps in Phoenix), interconnection queues (ERCOT 252 GW large-load queue, multi-year processing), and air permits (PSD adds 18-60 months) all bind in parallel. The macro ceiling is a multi-constraint reality: any one constraint can be solved with capital and time; the combination cannot, and a slip in any one cascades through the others. Deep Dive 29 covers this compounding structure in detail. The deficit is structural and is already binding in the form of the queue saturation, regulatory pauses, and operating-level shortfalls visible today.
3. Financial and credit mismatches kill traditional utility-scale deal structures.
Data center build-to-suit reaches stabilization in 3-4 years (developer hold-to-flip captures 25-40% dev IRR at exit; long-term hold cash payback at 9-11% YoC is 9-11 years and varies by market, lower yield in core markets with IG triple-net offtake, higher in frontier markets with renewal or sub-IG risk). A gas plant reaches stabilization in 6-8 years. The 15-year DC lease and 20-year PPA create a refinancing cliff at year 15. The capital stack assumes 30-40% sponsor equity and 55-65% project debt, sized to off-taker credit, which means an investment-grade hyperscaler is required, sub-IG is penalized, and non-rated counterparties cannot finance. Stage-gating puts development capital (5-10% of total cost, $125-250M for a 1 GW plant) at full risk for 24-36 months before financial close.
A real commercial tension worth naming: at frontier mega-sites (West Texas, Wyoming, Permian, rural ERCOT), some recent deals have been underwritten at 8-9% YoC on the assumption that residual value will support refinance at year 15. There is no proven re-leasing market at gigawatt scale outside core hubs. Same logic energy developers apply to the merchant tail should apply to DC residual: don't underwrite to a value you don't control. Disciplined frontier-market underwriting targets 9.5-10.5% YoC and treats residual as upside.
The case studies, Google's $4.75B Intersect Power acquisition, Nvidia's $3.5B+ committed across Lambda and CoreWeave, the Loudoun utility-only model collapse, show that the market is responding by vertically integrating up into power and down into compute infrastructure. Traditional utility-scale project finance is breaking under hyperscale weight.
The market's response patterns, vertical integration, hyperscaler pre-funding of dev capital, OEM equipment leases, utility partnerships, are all variants of one underlying principle: allocate each project risk to the party with the lowest cost of bearing it. When the three parties (DC developer, hyperscaler, energy developer) coordinate this allocation effectively, blended cost of capital across the stack falls and projects clear that would not otherwise be financeable. Deep Dive 30 frames this as the central capital-efficiency question of the market and surveys the six bridging structures observed in 2025-2026.
4. Chip efficiency gains buy time but do not solve the infrastructure problem.
Nvidia's GPU progression from V100 to B200 has delivered roughly 9× perf-per-watt over 8 years. Plausible 2030 efficiency improvement is 3-8×. Demand grows ~20-25% per year. Efficiency improves ~30-40% per year on AI workloads. They roughly cancel. Even at the aggressive 5× scenario, demand still outruns supply. The constraint is physical infrastructure (gas, transmission, permits, OEM, labor , gas is the most binding single variable; Deep Dive 22 covers regional sensitivities), pipelines, transmission, permits, turbine OEMs, EPC labor, none of which respond to silicon getting better. Optimization inside the stack (smaller models, FP8 and FP4 training, BESS for transients) helps but does not move the macro problem. Efficiency is buying time, not solving the constraint.
Synthesis
Physical infrastructure delivery, broadly defined to include gas, transmission, transformers, labor, water, permits, interconnection, materials, and capital markets, is the binding constraint on US AI compute through 2030 and likely beyond. It is already binding. It will be more binding in 2027-2028 per most published demand-growth forecasts.
The capital-efficiency answer is cross-stakeholder optimization. Hyperscale AI infrastructure requires three parties (the DC developer, the hyperscaler, the energy developer) to coordinate against the multi-constraint reality. The right allocation of each risk to the party with the lowest cost of bearing it lowers blended cost of capital across the stack and creates space for projects that would not otherwise clear. Done poorly, capital concentrates inefficiently and projects stall. Deep Dive 30 frames this as the central financing question of the market and surveys the bridging structures that have emerged. Done at integrated-platform scale, with diversified counterparty positions, this is the structural answer the market is converging on.
The reference project in this guide (1 GW gas + 1 GW DC, ERCOT, phased build, BTM ramp 2028 to grid 2032) is one pattern observed working today because it absorbs the four conclusions above into the design: phased gas as a near-term bridge to compress time to first compute, IG hyperscaler off-take to enable financing, integrated co-location to align lease and PPA timing, grid backstop after full COD to capture optionality, and explicit planning for the longer-term evolution toward nuclear, SMRs, and hybrid configurations as those technologies mature through 2028-2032. This is one viable pattern, not the only viable pattern. Other sponsors are pursuing utility partnerships, hyperscaler-direct integration, nuclear restart anchors, and renewables-plus-storage configurations, and all of those have economic merit in the right context. The common thread across all viable approaches is that they treat physical infrastructure as a multi-constraint reality rather than a single-input optimization, and that they organize cross-stakeholder risk-bearing so capital flows to its most efficient use.
Sources & Bibliography
All inline citations link to primary sources. The consolidated bibliography below is organized by topic for follow-up reading.
Macro supply, demand, and methodology
EIA Annual Energy Outlook (AEO) 2025/2026 , primary US energy demand and supply forecasts. eia.gov/outlooks/aeo
Google blog (infrastructure) , Intersect Power partnership.
TPG announcement , IPX Power launch and Intersect sale.
Tom's Hardware , Nvidia-Lambda deal.
Nvidia press releases , CoreWeave investments.
Loudoun Now , Loudoun County data center friction.
Texas Observer , Pacifico GW Ranch in Pecos County.
Note on confidence
Where a single trade-press article is the only source for a number (e.g., Halliburton/INNIO 2.3 GW manufacturing deal, specific reported deal sizes), confidence on that specific number is moderated. See Deep Dive 22 confidence levels. Several numbers in this guide carry "as reported" confidence rather than primary-document confidence; flagged where material.
Full URL footnotes are inline in each section above.